On this page
Prometheus监控
1.Linux
1.1.Node exporter
Node_exporter是可以在* Nix和Linux系统上运行的计算机度量标准的导出器。
Node_exporter 主要用于暴露 metrics 给 Prometheus,其中 metrics 包括:cpu 的负载,内存的使用情况,网络等。
1
2
3
4
5
6
7
8
# node_exporter

# github
https://github.com/prometheus/node_exporter

# dockerhub
prom/node-exporter
https://hub.docker.com/r/prom/node-exporter/
1.2.安装部署
1
2
3
4
5
6
7
# 运行docker
docker run -d --name node-exporter --network host --restart = always \
-v "/proc:/host/proc:ro" \
-v "/sys:/host/sys:ro" \
-v "/:/rootfs:ro" \
prom/node-exporter
1
2
3
4
# 访问地址

http://47.95.238.119:9100/metrics
curl '172.17.88.22:9100/metrics'
1
2
3
4
5
6
7
8
9
10
11
12
13
14
15
16
17
18
19
# 配置prometheus
- job_name: centos-1
static_configs:
- targets: [ '172.17.88.22:9100' ]
labels:
instance: node-1
- job_name: centos-2
static_configs:
- targets: [ '172.17.88.19:9100' ]
labels:
instance: node-2
- job_name: centos-3
static_configs:
- targets: [ '172.17.88.18:9100' ]
labels:
instance: node-3
1
2
3
4
5
6
7
8
9
10
11
12
13
# 搜索官网模板
https://grafana.com/
https://grafana.com/grafana/dashboards
# 选择模板
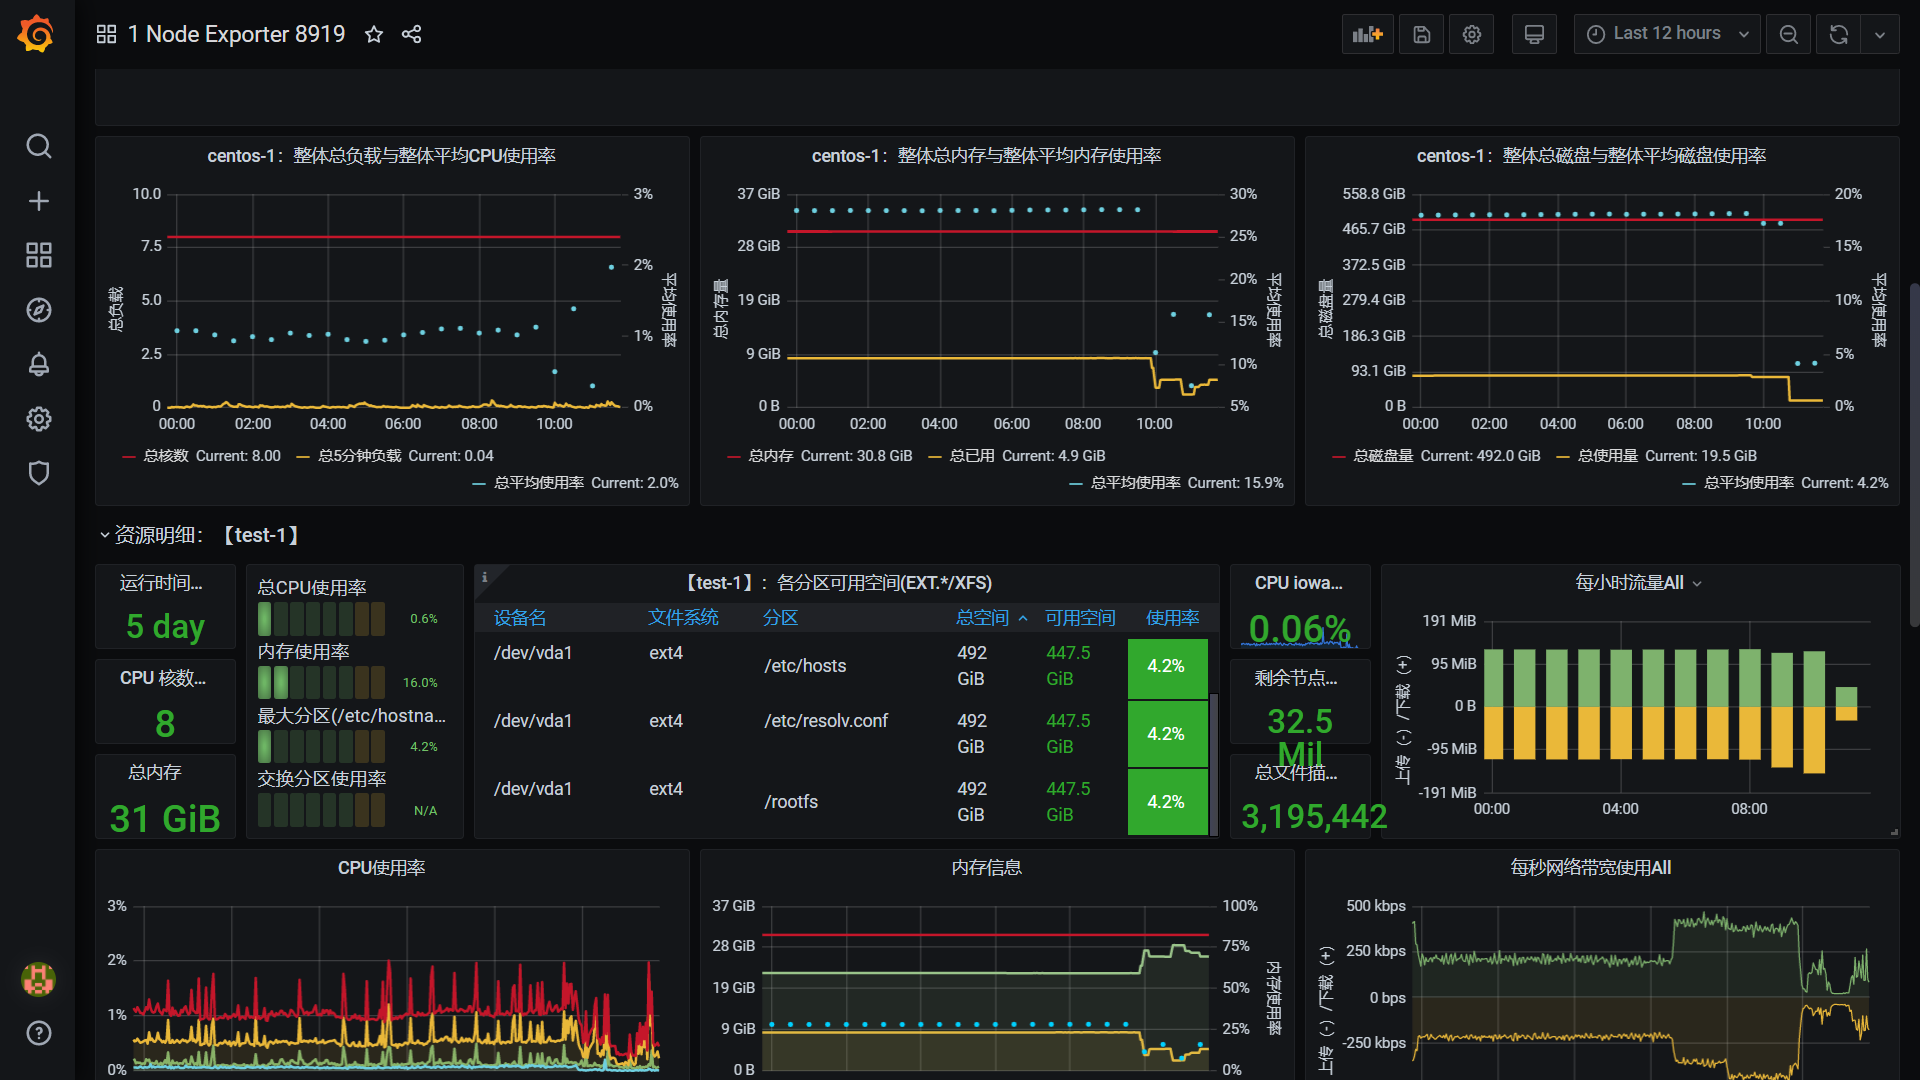
# 8919
https://grafana.com/grafana/dashboards/8919
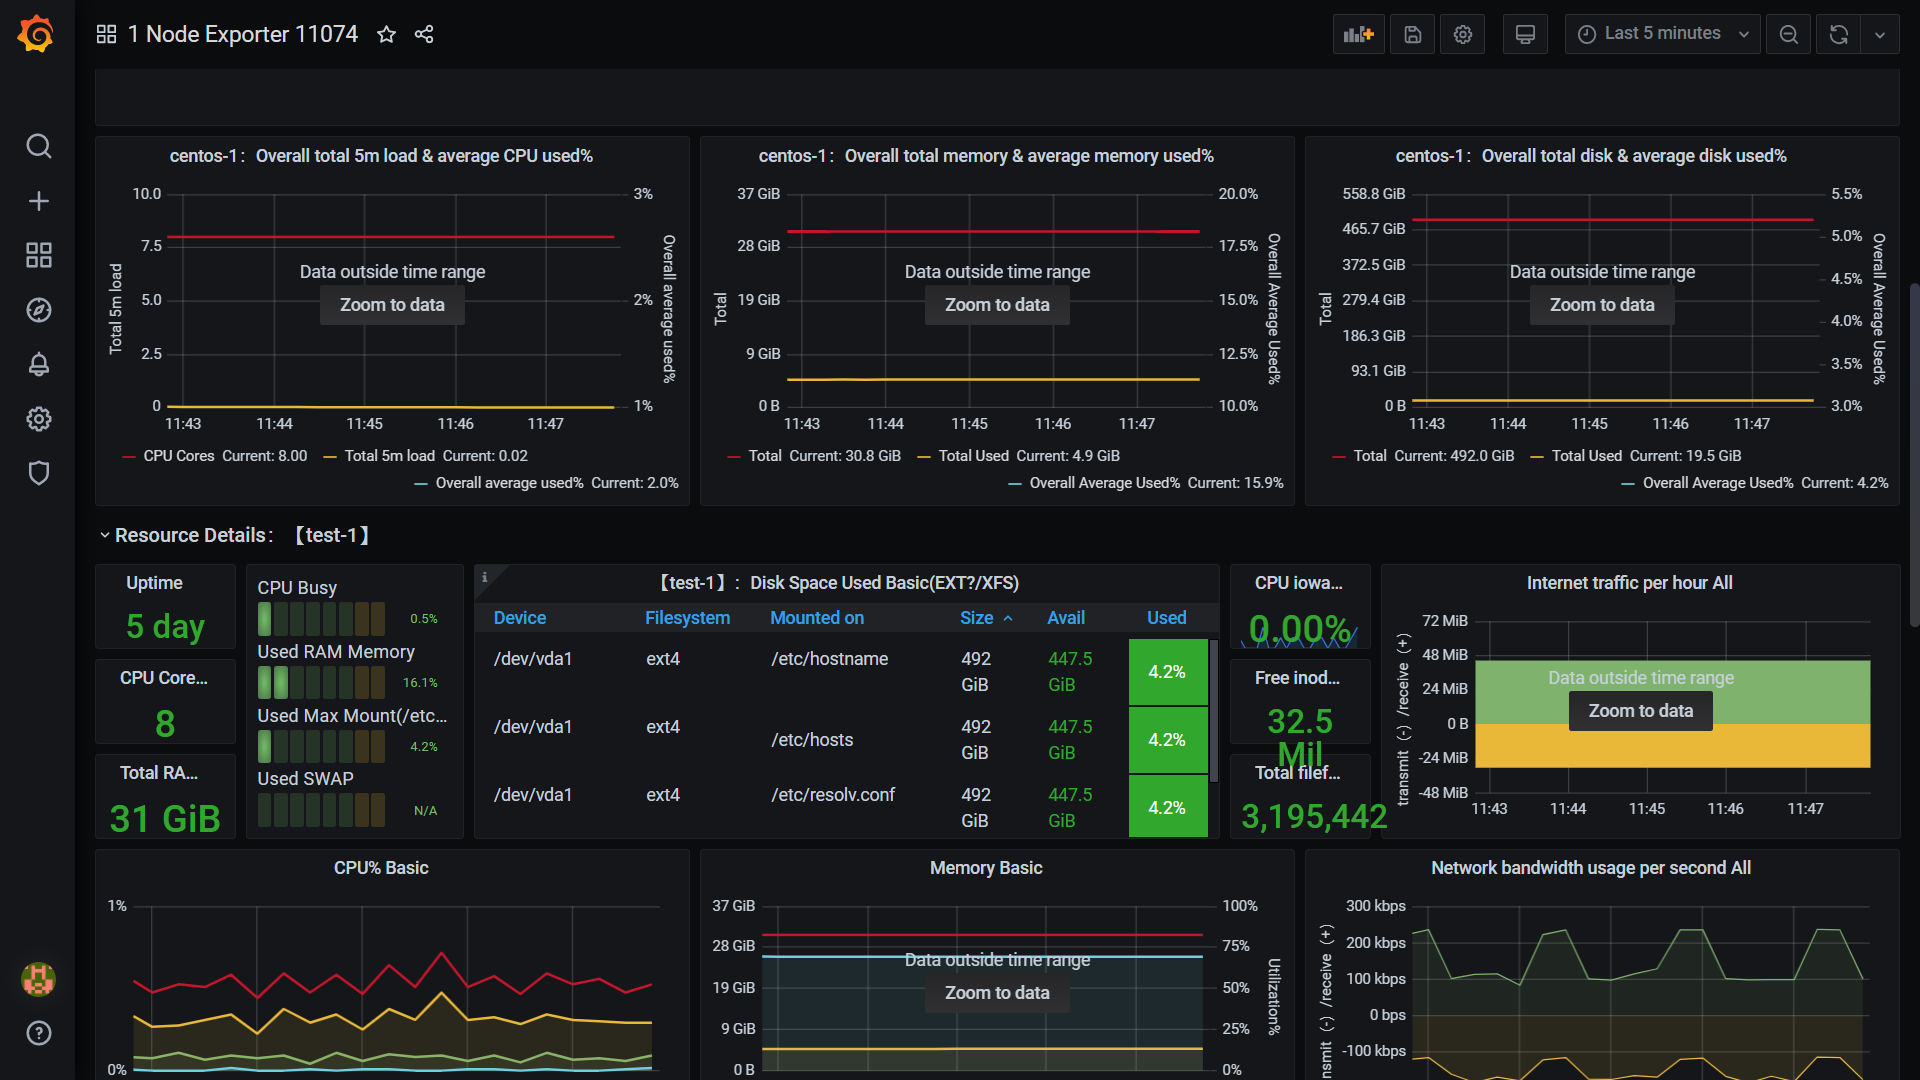
# 11074
https://grafana.com/grafana/dashboards/11074
# 参考模板
9276 1860
2.Windows
2.1.windows_exporter
1
2
3
4
# windows_exporter

# github
https://github.com/prometheus-community/windows_exporter
2.2.安装部署
在需要监控的Windows机器上安装wmi_exporterwmi_exporter下载地址:
https://github.com/martinlindhe/wmi_exporter/releases
下载后,双击即可完成安装。
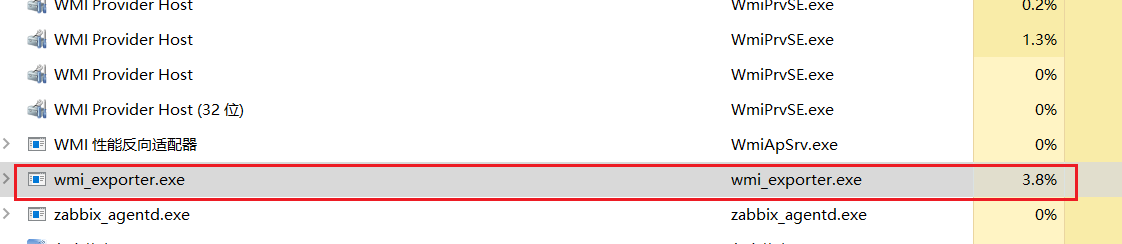
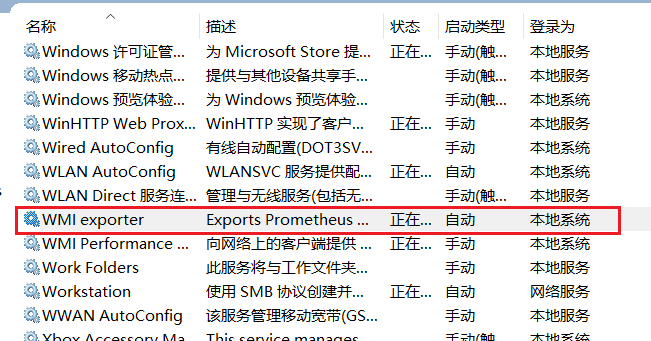
完成安装后,会自动创建一个开机自启的服务
验证服务是否启动,默认wmi-exporter端口为9182
浏览器访问 http://192.168.56.1:9182/metrics
1
2
3
4
# 访问地址

http://47.95.238.119:9182/metrics
curl '172.17.88.22:9182/metrics'
1
2
3
4
5
6
7
# 配置prometheus
- job_name: 'Windows'
static_configs:
- targets: [ '192.168.0.100:9182' ]
labels:
instance: win
1
2
3
4
5
6
7
8
9
10
11
12
13
# 搜索官网模板
https://grafana.com/
https://grafana.com/grafana/dashboards

# 选择模板
# 10467
https://grafana.com/grafana/dashboards/10467

# 2129
https://grafana.com/grafana/dashboards/2129

# 参考模板
6545
3.Docker
3.1.cadvisor
CAdvisor是谷歌开发的用于分析运行中容器的资源占用和性能指标的开源工具。CAdvisor是一个运行时的守护进程,负责收集、聚合、处理和输出运行中容器的信息。
1
2
3
4
5
6
7
8
# cadvisor

# github
https://github.com/google/cadvisor

# dockerhub
google/cadvisor
https://hub.docker.com/r/google/cadvisor
3.2.安装部署
1
2
3
4
5
6
7
# 运行docker
docker run -d -p 9601:8080 --name cadvisor --restart = always \
-v /:/rootfs:ro \
-v /var/run:/var/run:rw \
-v /sys:/sys:ro \
-v /var/lib/docker/:/var/lib/docker:ro \
1
2
3
4
# 访问地址

http://47.95.238.119:9601/metrics
curl '172.17.88.22:9601/metrics'
1
2
3
4
5
6
7
8
9
10
11
12
13
14
15
16
17
18
19
# 配置prometheus
- job_name: docker-1
static_configs:
- targets: [ '172.17.88.22:9601' ]
labels:
instance: dk-1
- job_name: docker-2
static_configs:
- targets: [ '172.17.88.19:9601' ]
labels:
instance: dk-2
- job_name: docker-3
static_configs:
- targets: [ '172.17.88.18:9601' ]
labels:
instance: dk3-3
1
2
3
4
5
6
7
8
9
10
11
12
13
14
15
16
17
# 搜索官网模板
https://grafana.com/
https://grafana.com/grafana/dashboards
# 选择模板
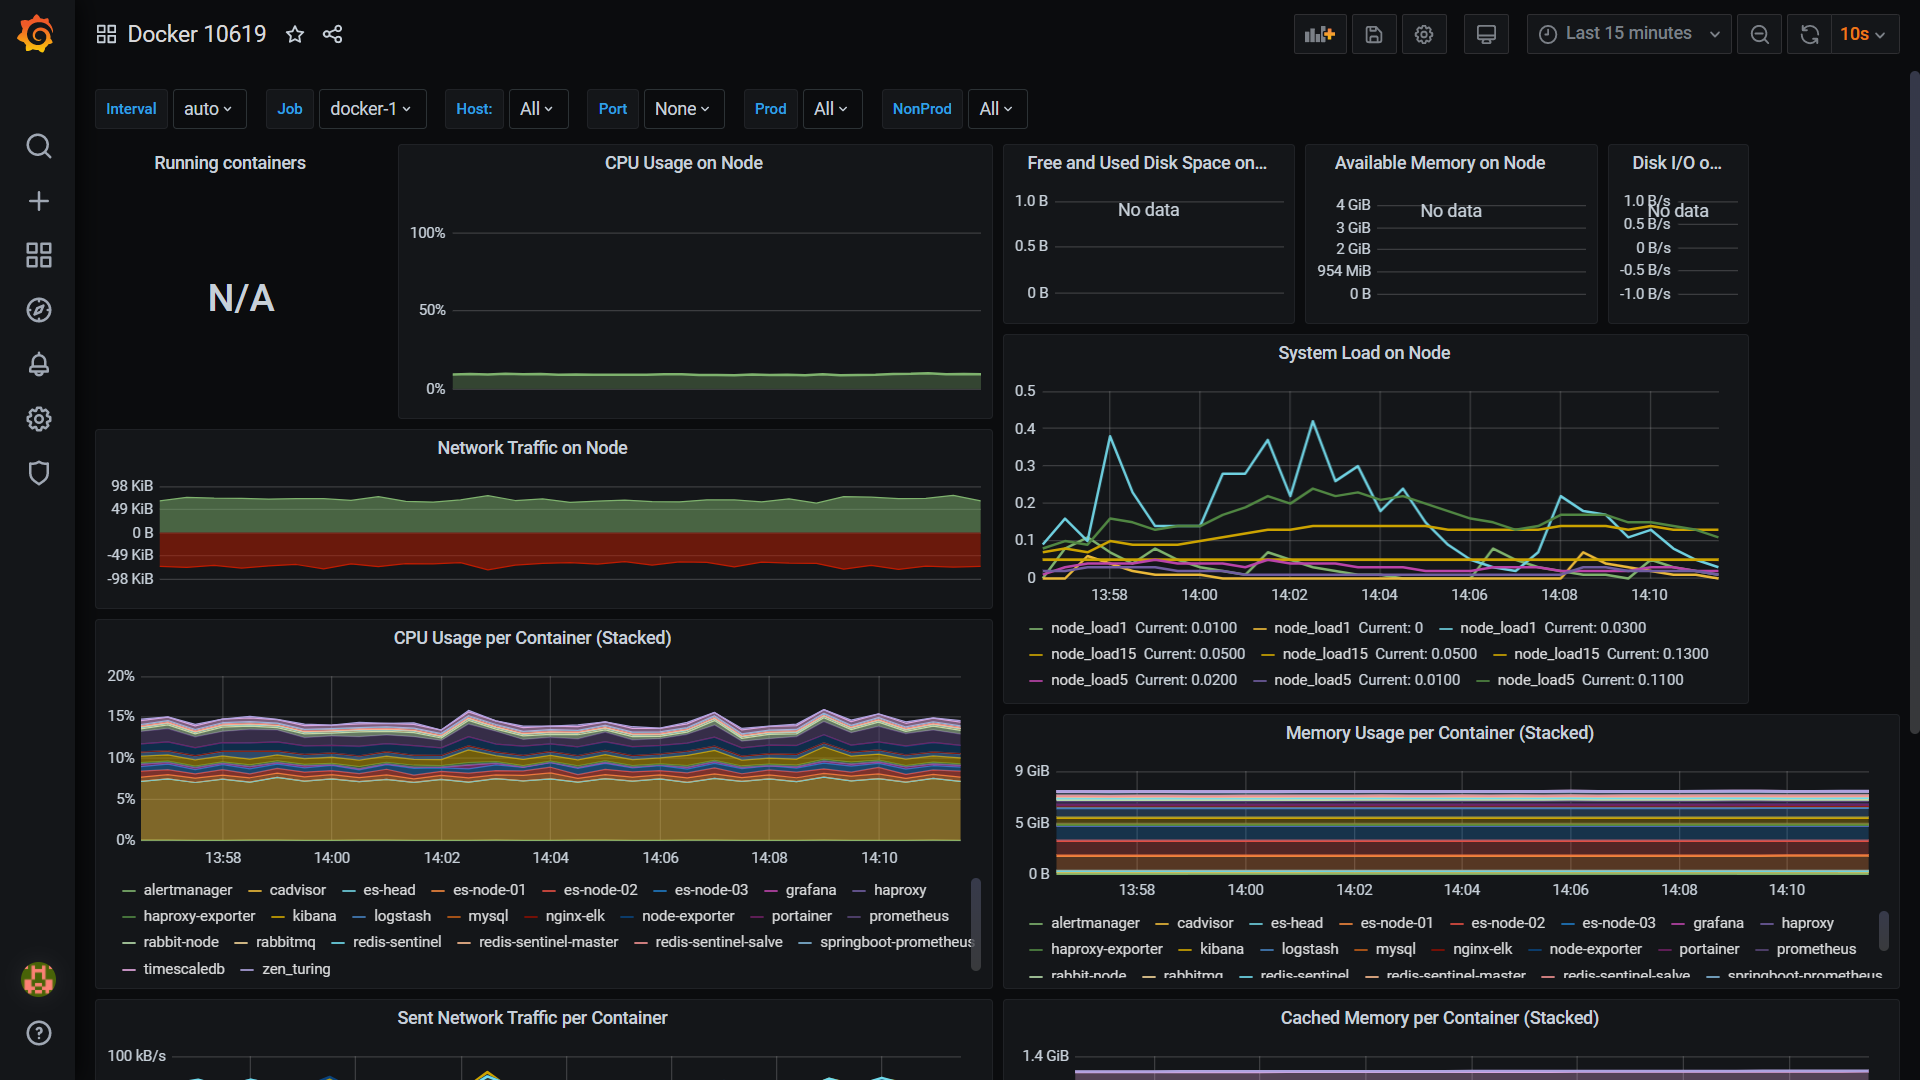
# 10619
https://grafana.com/grafana/dashboards/10619
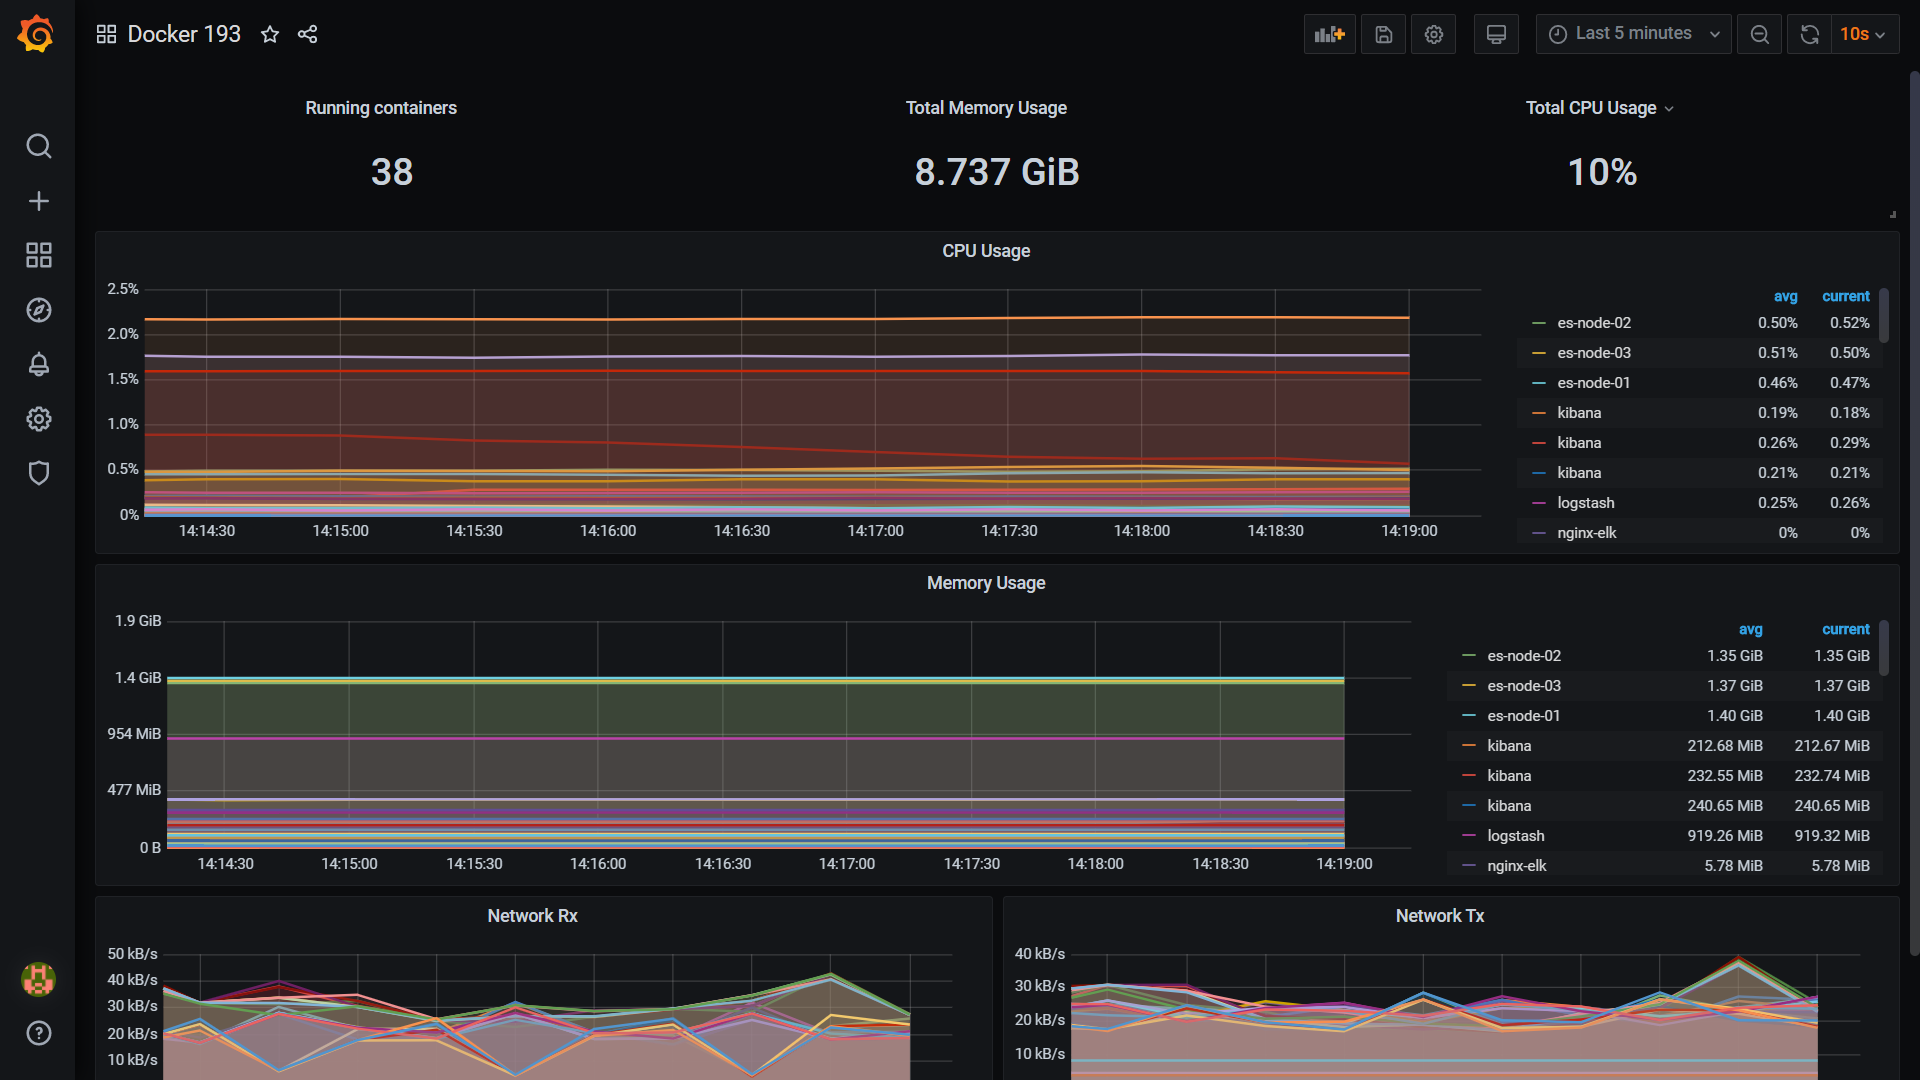
# 193
https://grafana.com/grafana/dashboards/193
# 参考模板
395 893
193 11277
11558
179
4.Nginx
4.1.nginx-vts-exporter
nginx-module-vts: Nginx virtual host traffic status module,nginx的监控模块,能够提供json、html、prometheus格式的数据产出。
nginx-vts-exporter: Simple server that scrapes Nginx vts stats and exports them via HTTP for Prometheus consumption。主要用于收集nginx的监控数据,并给Prometheus提供监控接口,默认端口号9913。
1
2
3
4
5
6
7
8
9
10
11
# nginx-vts-exporter

# github
nginx-vts-exporter
https://github.com/hnlq715/nginx-vts-exporter
nginx-module-vts
https://github.com/vozlt/nginx-module-vts

# dockerhub
sophos/nginx-vts-exporter
https://hub.docker.com/r/sophos/nginx-vts-exporter
4.2.安装部署
1
2
3
4
# 运行docker
docker run -d --net = host --name nginx-vts-exporter --restart = always \
--env NGINX_STATUS = "http://172.17.88.18/status/format/json" sophos/nginx-vts-exporter
1
2
3
4
# 访问地址

http://47.95.238.119:9913/metrics
curl '172.17.88.18:9913/metrics'
1
2
3
4
5
6
7
# 配置prometheus
- job_name: nginx-3
static_configs:
- targets: [ '172.17.88.18:9913' ]
labels:
instance: nx-3
1
2
3
4
5
6
# 选择模板
# 2949
https://grafana.com/grafana/dashboards/2949

# 参考模板
9785
5.Redis
5.1.redis_exporter
1
2
3
4
5
6
7
8
# redis_exporter

# github
https://github.com/oliver006/redis_exporter

# dockerhub
oliver006/redis_exporter
https://hub.docker.com/r/oliver006/redis_exporter/
5.2.安装部署
1
2
3
4
# 运行docker
docker run -d --name redis-exporter --network host --restart = always \
oliver006/redis_exporter
1
2
3
4
# 访问地址

http://47.95.238.119:9121/metrics
curl '172.17.88.22:9121/metrics'
1
2
3
4
5
6
# 选择模板
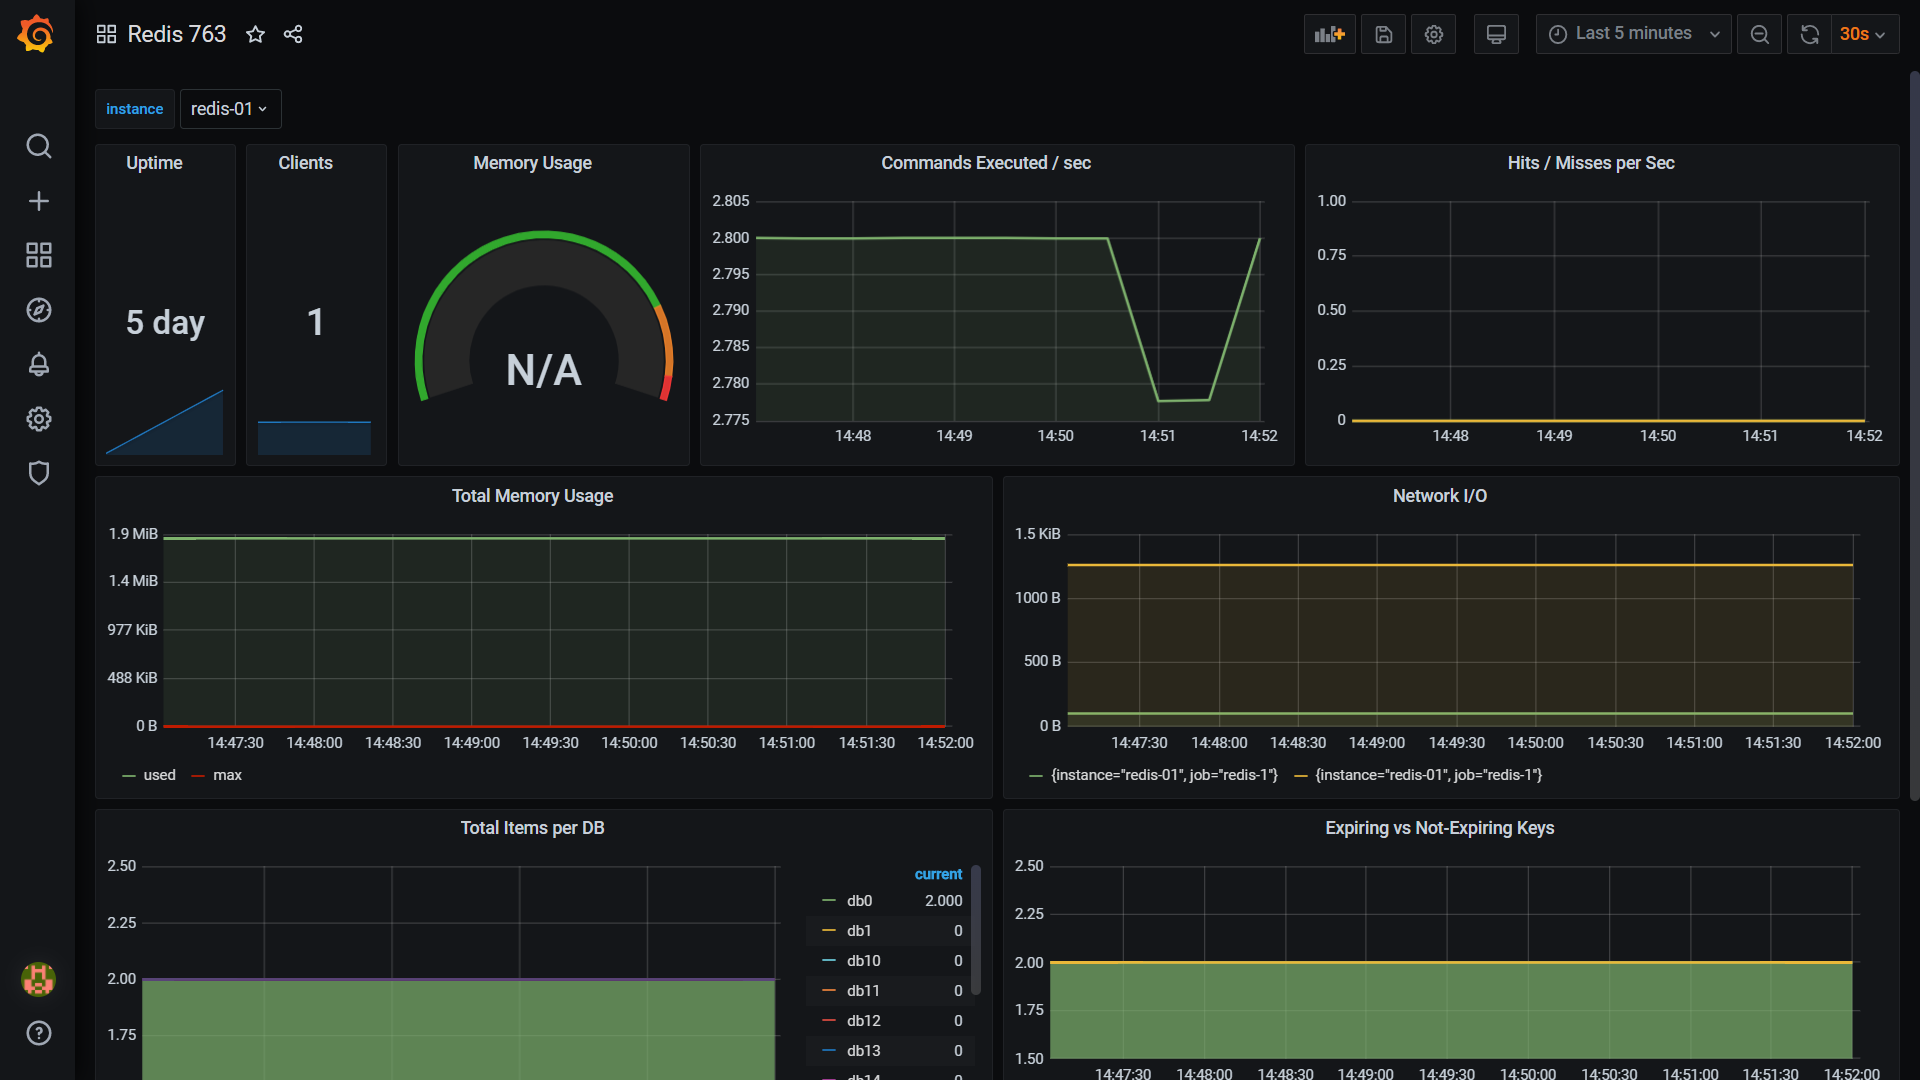
# 763
https://grafana.com/grafana/dashboards/763
# 参考模板
4074 12497
6.RabbitMQ
6.1.rabbitmq_exporter
1
2
3
4
5
6
7
8
# rabbitmq_exporter

# github
https://github.com/kbudde/rabbitmq_exporter

# dockerhub
kbudde/rabbitmq-exporter
https://hub.docker.com/r/kbudde/rabbitmq-exporter
6.2.安装部署
1
2
3
4
# 运行docker
docker run -d --net = container:rabbit-node1 --name rabbitmq-exporter --restart = always \
kbudde/rabbitmq-exporter
1
2
3
4
# 访问地址

http://47.95.238.119:9419/metrics
curl '172.17.88.22:9419/metrics'
1
2
3
4
5
6
7
8
9
10
11
12
13
14
15
16
17
18
19
# 配置prometheus
- job_name: rabbitmq-1
static_configs:
- targets: [ '172.17.88.22:9419' ]
labels:
instance: mq-1
- job_name: rabbitmq-2
static_configs:
- targets: [ '172.17.88.19:9419' ]
labels:
instance: mq-2
- job_name: rabbitmq-3
static_configs:
- targets: [ '172.17.88.18:9419' ]
labels:
instance: mq-3
1
2
3
4
5
6
7
8
9
# 选择模板
# 10120
https://grafana.com/grafana/dashboards/10120

# 4279
https://grafana.com/grafana/dashboards/4279

# 参考模板
2121  4371
7.PostgreSQL
7.1.postgres_exporter
1
2
3
4
5
6
7
8
# postgres_exporter

# github
https://github.com/wrouesnel/postgres_exporter

# dockerhub
postgres_exporter
https://hub.docker.com/r/wrouesnel/postgres_exporter/tags
7.2.安装部署
1
2
3
4
5
# 运行docker
docker run -d --network host --name postgres_exporter --restart = always \
-e DATA_SOURCE_NAME = "postgresql://postgres:123456@172.17.88.22:5432/postgres?sslmode=disable" \
wrouesnel/postgres_exporter
1
2
3
4
# 访问地址

http://47.95.238.119:9187/metrics
curl '172.17.88.22:9187/metrics'
1
2
3
4
5
6
7
8
9
10
11
12
13
# 配置prometheus
- job_name: postgres-1
static_configs:
- targets: [ '172.17.88.22:9187' ]
labels:
instance: pg-1
- job_name: postgres-2
static_configs:
- targets: [ '172.17.88.19:9187' ]
labels:
instance: pg-2
1
2
3
4
5
6
7
8
9
# 选择模板
# 455
https://grafana.com/grafana/dashboards/455

# 9628
https://grafana.com/grafana/dashboards/9628

# 参考模板
3742
8.MySQL
8.1.mysqld_exporter
1
2
3
4
5
6
7
8
# mysqld_exporter

# github
https://github.com/prometheus/mysqld_exporter

# dockerhub
mysqld_exporter
https://registry.hub.docker.com/r/prom/mysqld-exporter
8.2.安装部署
1
2
3
4
5
# 运行docker
docker run -d --network host --name mysqld-exporter --restart = always \
-e DATA_SOURCE_NAME = "root:root@(172.17.88.22:3306)/" \
prom/mysqld-exporter
1
2
3
4
# 访问地址

http://47.95.238.119:9104/metrics
curl '172.17.88.22:9104/metrics'
1
2
3
4
5
6
7
# 配置prometheus
- job_name: mysql
static_configs:
- targets: [ '172.17.88.22:9104' ]
labels:
instance: mysqld
1
2
3
4
5
6
7
8
9
# 选择模板
# 11323
https://grafana.com/grafana/dashboards/11323

# 7362
https://grafana.com/grafana/dashboards/7362

# 参考模板
9623  6239
9.Haproxy
9.1.haproxy_exporter
1
2
3
4
5
6
7
8
# haproxy_exporter

# github
https://github.com/prometheus/haproxy_exporter

# dockerhub
prom/haproxy-exporter
https://hub.docker.com/r/prom/haproxy-exporter
9.2.安装部署
1
2
3
4
# 运行docker
docker run -d --network host --name haproxy-exporter --restart = always \
prom/haproxy-exporter --haproxy .scrape-uri= "http://172.17.88.18:8999/haproxy?stats;csv"
1
2
3
4
# 访问地址

http://47.95.238.119:9101/metrics
curl '172.17.88.22:9101/metrics'
1
2
3
4
5
6
7
# 配置prometheus
- job_name: haproxy
static_configs:
- targets: [ '172.17.88.18:9101' ]
labels:
instance: ha1
1
2
3
4
5
6
7
8
9
# 选择模板
# 2428
https://grafana.com/grafana/dashboards/2428

# 12030
https://grafana.com/grafana/dashboards/12030

# 参考模板
367
10.Elasticsearch
10.1.elasticsearch_exporter
1
2
3
4
5
6
7
8
# elasticsearch_exporter

# github
https://github.com/justwatchcom/elasticsearch_exporter

# dockerhub
justwatch/elasticsearch_exporter
https://hub.docker.com/r/justwatch/elasticsearch_exporter
10.2.安装部署
1
2
3
4
5
6
7
8
9
10
11
12
13
14
15
16
17
18
19
20
21
22
23
24
25
26
27
28
29
30
31
32
33
34
35
36
37
38
39
40
41
42
43
44
45
46
# 运行docker
# 直接运行
./elasticsearch_exporter \
--es .all --es .indices --es .cluster_settings \
--es .indices_settings --es .shards --es .snapshots \
--es .timeout= 10s --web .listen-address= ":9114" \
--web .telemetry-path= "/metrics" \
--es .uri http://172.17.88.22:9200
./elasticsearch_exporter \
--es .all --es .indices --es .cluster_settings \
--es .indices_settings --es .shards --es .snapshots \
--es .timeout= 10s --web .listen-address= ":9114" \
--web .telemetry-path= "/metrics" \
--es .uri http://172.17.88.19:9200
./elasticsearch_exporter \
--es .all --es .indices --es .cluster_settings \
--es .indices_settings --es .shards --es .snapshots \
--es .timeout= 10s --web .listen-address= ":9114" \
--web .telemetry-path= "/metrics" \
--es .uri http://172.17.88.18:9200
# 后台运行
nohup ./elasticsearch_exporter \
--es .all --es .indices --es .cluster_settings \
--es .indices_settings --es .shards --es .snapshots \
--es .timeout= 10s --web .listen-address= ":9114" \
--web .telemetry-path= "/metrics" \
--es .uri http://172.17.88.22:9200 &
nohup ./elasticsearch_exporter \
--es .all --es .indices --es .cluster_settings \
--es .indices_settings --es .shards --es .snapshots \
--es .timeout= 10s --web .listen-address= ":9114" \
--web .telemetry-path= "/metrics" \
--es .uri http://172.17.88.19:9200 &
nohup ./elasticsearch_exporter \
--es .all --es .indices --es .cluster_settings \
--es .indices_settings --es .shards --es .snapshots \
--es .timeout= 10s --web .listen-address= ":9114" \
--web .telemetry-path= "/metrics" \
--es .uri http://172.17.88.18:9200 &
1
2
3
4
# 访问地址

http://47.95.238.119:9114/metrics
curl '172.17.88.22:9114/metrics'
1
2
3
4
5
6
7
8
9
10
11
12
13
14
15
16
17
18
19
# 配置prometheus
- job_name: elasticsearch-1
static_configs:
- targets: [ '172.17.88.22:9114' ]
labels:
instance: es-1
- job_name: elasticsearch-2
static_configs:
- targets: [ '172.17.88.19:9114' ]
labels:
instance: es-2
- job_name: elasticsearch-3
static_configs:
- targets: [ '172.17.88.18:9114' ]
labels:
instance: es-3
1
2
3
4
5
6
7
8
9
# 选择模板
# 6483
https://grafana.com/grafana/dashboards/6483

# 2322
https://grafana.com/grafana/dashboards/2322

# 参考模板
9746    266
© 2024 IoTHub - 物联网开源技术社区