
一、告警通知
1.邮件通知
- 配置信息
1
2
3
4
5
6
7
8
9
10
11
12
13
14
15
16
17
18
19
20
21
22
23
24
25
26
27
28
29
30
31
32
33
34
35
36
37
38
# 配置信息


### 配置文件 alertmanager.yml
/prometheus/alertmanager/alertmanager.yml
touch alertmanager.yml

global:  # 全局配置项
  resolve_timeout: 5m #超时,默认5min
  smtp_smarthost: 'smtp.163.com:465'
  smtp_from: 'hollysys_test@163.com'
  smtp_auth_username: 'hollysys_test@163.com'
  smtp_auth_password: 'XXXXXXXX'  # 授权码:XXXXXXXX
  smtp_require_tls: false

templates:  # 定义模板信息
  - 'template/*.tmpl'   # 路径

route:  # 路由
  group_by: ['alertname'] # 报警分组依据
  group_wait: 10s #组等待时间
  group_interval: 10s # 发送前等待时间
  repeat_interval: 1h #重复周期
  receiver: 'mail' # 默认警报接收者

receivers:  # 警报接收者
- name: 'mail' #警报名称
  email_configs:
  - to: ''  #接收警报的email
    html: '' # 模板
    send_resolved: true

inhibit_rules:  # 告警抑制
  - source_match:
      severity: 'critical'
    target_match:
      severity: 'warning'
    equal: ['alertname', 'dev', 'instance']
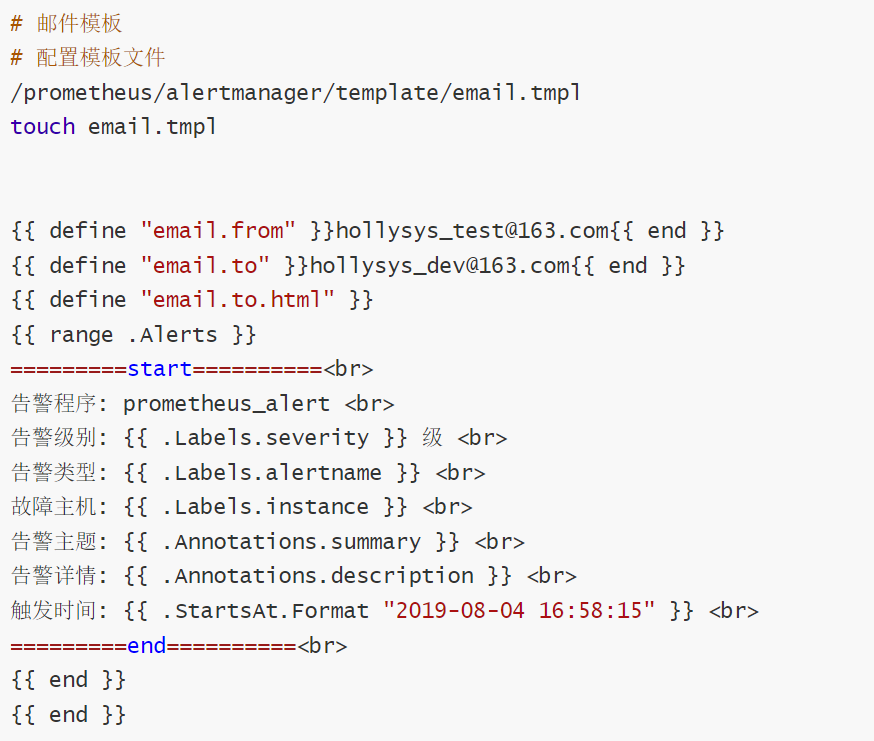
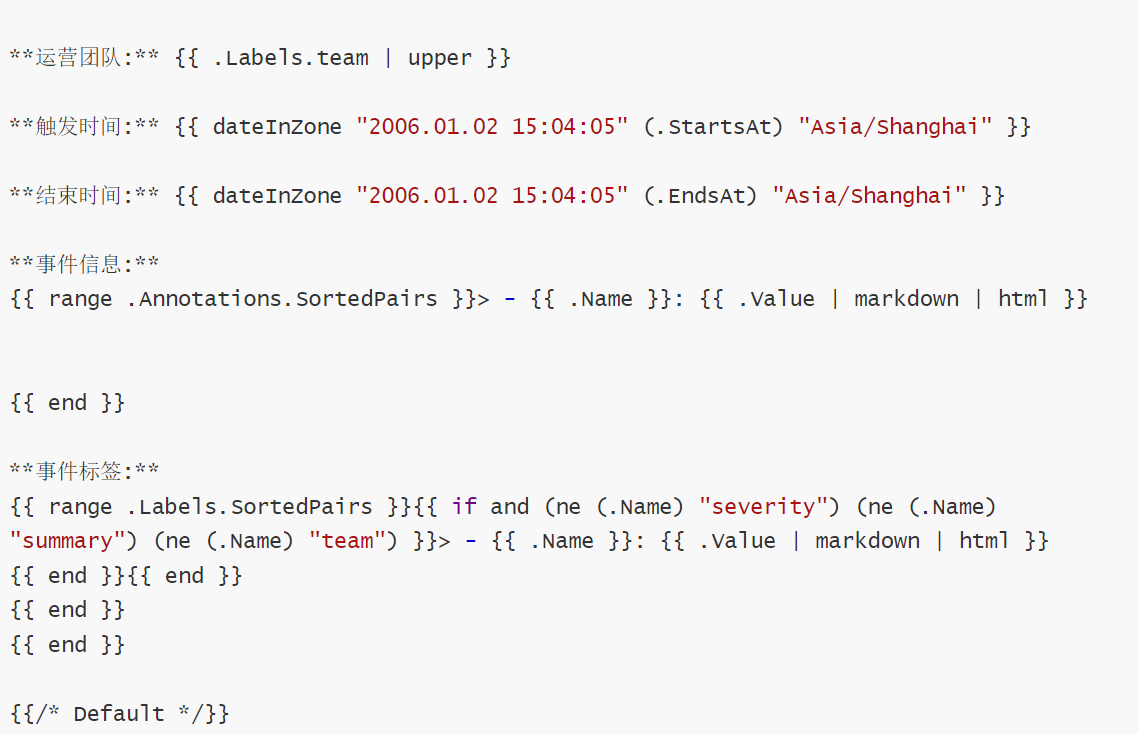
- 自定义邮件模板
2.钉钉通知
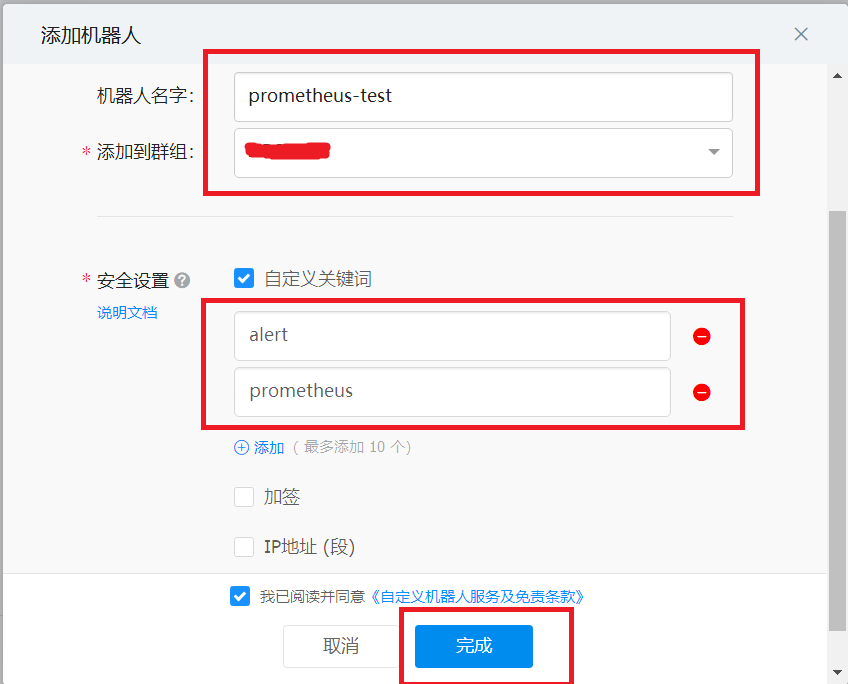
2.1.获取钉钉机器人webhook
- 配置信息


2.2.prometheus-webhook-dingtalk
1
2
3
4
5
6
7
8
# prometheus-webhook-dingtalk

# timonwong /prometheus-webhook-dingtalk
https://github.com/timonwong/prometheus-webhook-dingtalk
https://hub.docker.com/r/timonwong/prometheus-webhook-dingtalk

# Webhook
https://oapi.dingtalk.com/robot/send?access_token=d8e443b4fe8512dba6c764afad94bd361fbf71c6f612c8de3bcf88d8ae545ed53
1
2
3
4
5
6
# 拉取镜像
docker pull timonwong/prometheus-webhook-dingtalk

# 运行docker
docker run -d -p 8060:8060 --name webhook-dingding timonwong/prometheus-webhook-dingtalk:latest \
--ding.profile="webhook1=https://oapi.dingtalk.com/robot/send?access_token=d8e443b4fe8512dba6c764afad94bd361fbf71c6f612c8de3bcf88d8ae545ed53"
2.3.配置信息
1
2
3
4
5
6
7
8
9
10
11
12
13
14
15
16
17
18
19
20
21
22
23
24
25
# 配置信息


### 配置文件 alertmanager.yml
/prometheus/alertmanager/alertmanager.yml
touch alertmanager.yml

global:  # 全局配置项
  resolve_timeout: 5m #超时,默认5min

route:  # 路由
  receiver: webhook
  group_by: ['alertname'] # 报警分组依据
  group_wait: 10s #组等待时间
  group_interval: 10s # 发送前等待时间
  repeat_interval: 1h #重复周期
  routes:
  - receiver: webhook
    group_wait: 10s

receivers:
- name: webhook
  webhook_configs:
  - url: http://172.17.88.22:8060/dingtalk/webhook1/send
    send_resolved: true
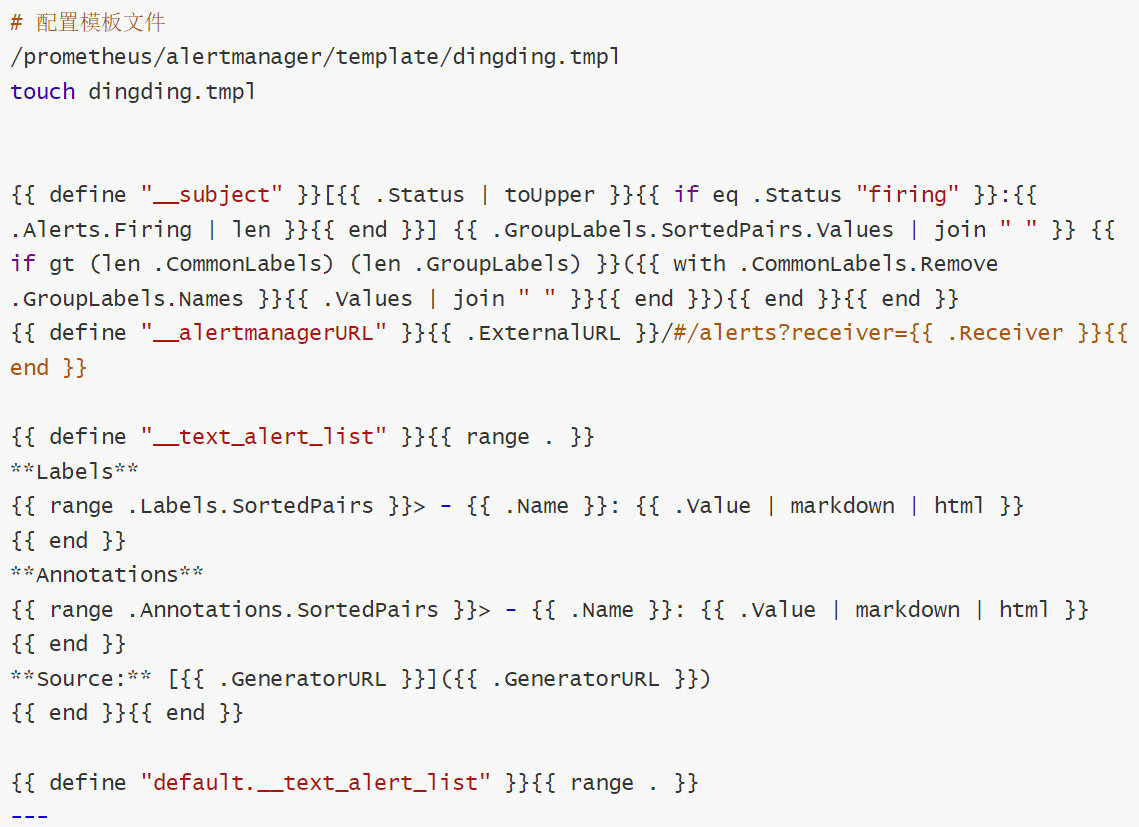
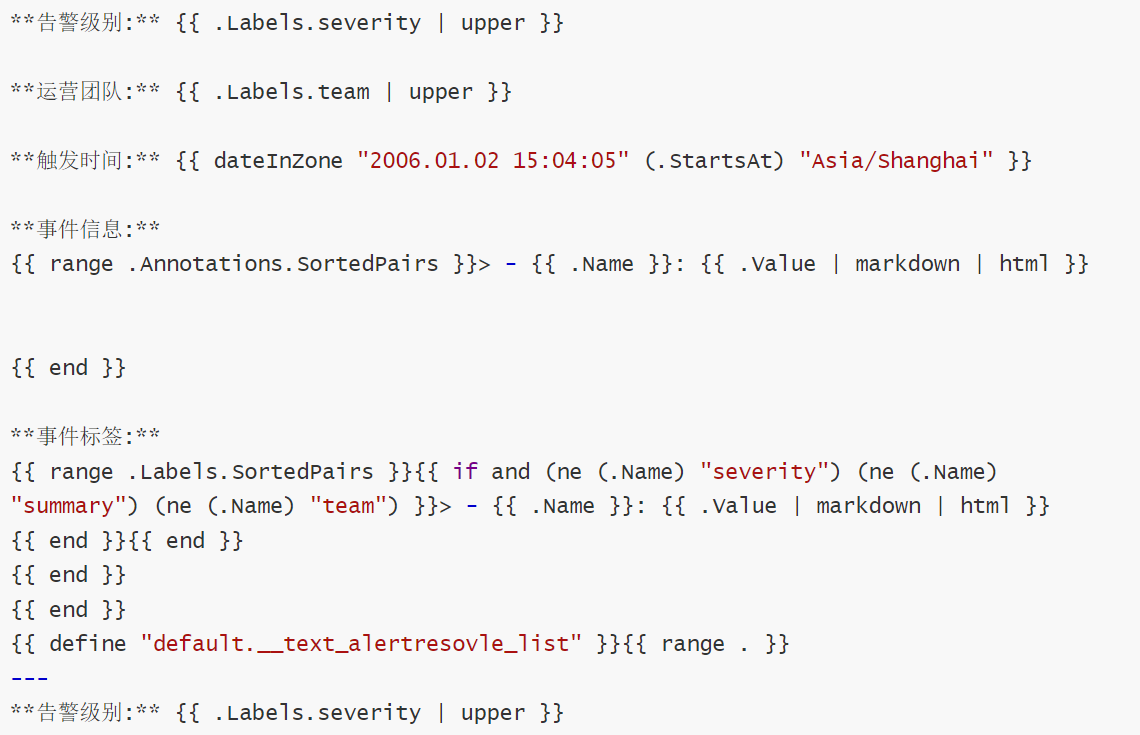
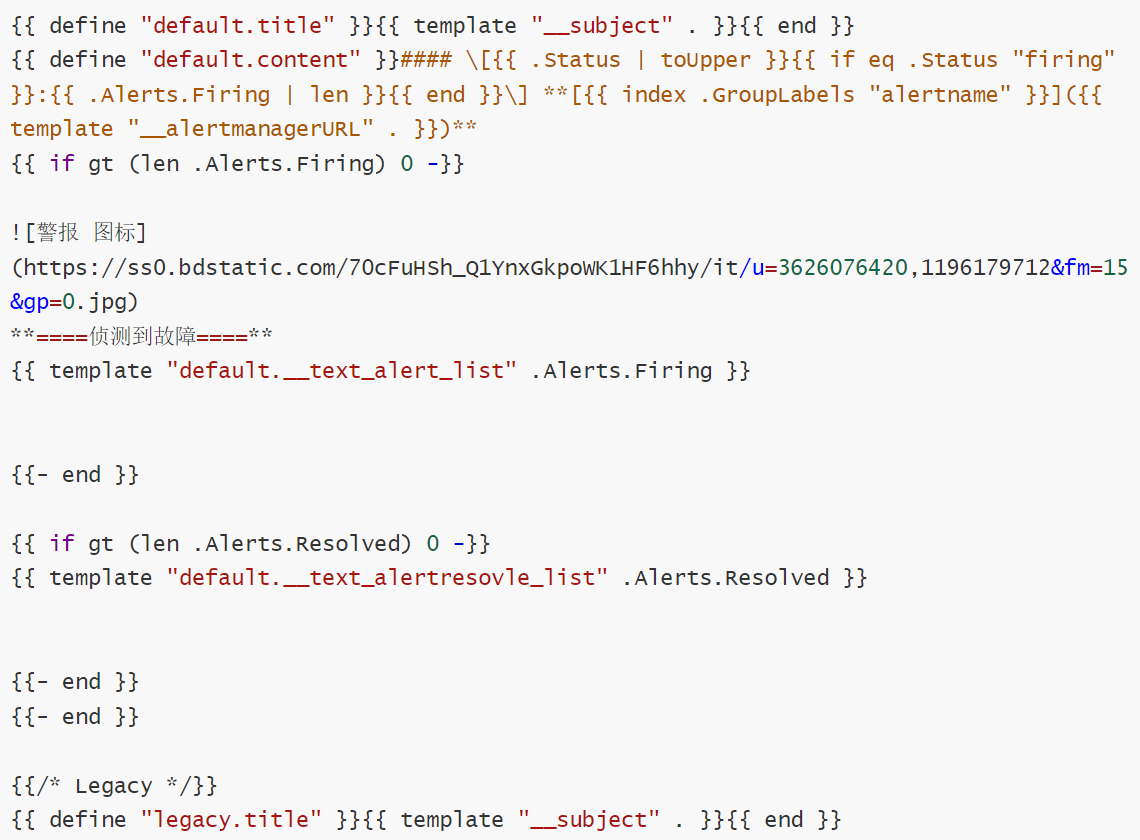
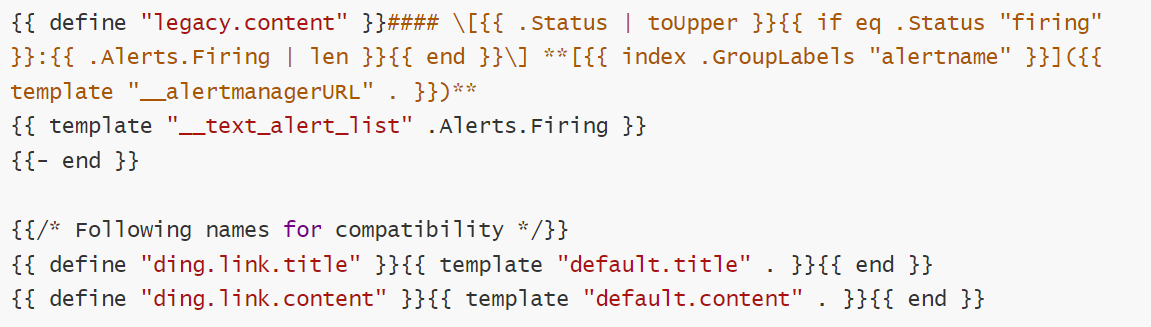
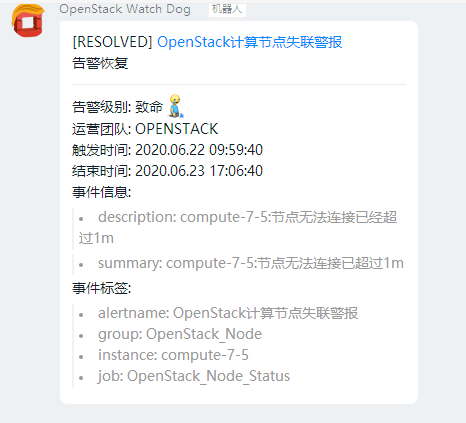
2.4.自定义模板

3.自定义
- 配置信息
1
2
3
4
5
6
7
8
9
10
11
12
13
14
15
16
17
18
19
20
# 配置信息

### 配置文件 alertmanager.yml
/prometheus/alertmanager/alertmanager.yml
touch alertmanager.yml

global:  # 全局配置项
  resolve_timeout: 5m #超时,默认5min

route:  # 路由
  group_by: ['alertname'] # 报警分组依据
  group_wait: 10s #组等待时间
  group_interval: 10s # 发送前等待时间
  repeat_interval: 1h #重复周期
  receiver: webhook

receivers:
- name: webhook
  webhook_configs:
  - url: http://172.17.88.22:8888/monitor
- 自定义接口
1
2
3
4
5
6
7
8
9
10
11
12
13
14
15
16
17
18
19
20
21
22
# AlertController
@Slf4j
@Controller
@RequestMapping("/")
public class AlertController {

    @RequestMapping(value = "/monitor", produces = "application/json;charset=UTF-8")
    @ResponseBody
    public String monitor(@RequestBody String json) {

        log.info("alert notify  params: {}", json);


        Map<String, Object> result = new HashMap<>();
        result.put("msg", "报警失败");
        result.put("code", 0);
        return JSON.toJSONString(result);
    }
}

# 接口地址
url: http://172.17.88.22:8888/monitor
1
2
3
4
5
6
7
8
9
10
11
12
13
14
15
16
17
18
19
20
21
22
23
24
25
26
27
28
29
30
31
32
33
34
35
36
37
38
39
40
41
42
43
44
45
46
47
48
49
50
51
52
53
54
55
56
57
58
59
60
61
62
63
64
65
66
67
68
69
70
71
72
73
74
75
76
77
78
79
80
81
82
83
84
85
# 报警数据

# 触发报警数据:
{
 "receiver": "webhook",
 "status": "firing",
 "alerts": [{
   "status": "firing",
   "labels": {
    "alertname": "node-up",
    "instance": "node-3",
    "job": "centos-3",
    "severity": "1",
    "team": "node"
   },
   "annotations": {
    "description": "node-3 检测到异常停止!请重点关注!!!",
    "summary": "node-3 已停止运行! alert"
   },
   "startsAt": "2020-08-20T07:09:35.987923059Z",
   "endsAt": "0001-01-01T00:00:00Z",
   "generatorURL": "http://test-1:9090/graph?g0.expr=up%7Bjob%3D%22centos-3%22%7D+%3D%3D+0\u0026g0.tab=1",
   "fingerprint": "d0412b7cebb1a039"
 }],
 "groupLabels": {
   "alertname": "node-up"
 },
 "commonLabels": {
   "alertname": "node-up",
   "instance": "node-3",
   "job": "centos-3",
   "severity": "1",
   "team": "node"
 },
 "commonAnnotations": {
   "description": "node-3 检测到异常停止!请重点关注!!!",
   "summary": "node-3 已停止运行! alert"
 },
 "externalURL": "http://test-1:9093",
 "version": "4",
 "groupKey": "{}:{alertname=\"node-up\"}",
 "truncatedAlerts": 0
}

# 恢复报警数据:
{
 "receiver": "webhook",
 "status": "resolved",
 "alerts": [{
   "status": "resolved",
   "labels": {
    "alertname": "node-up",
    "instance": "node-3",
    "job": "centos-3",
    "severity": "1",
    "team": "node"
   },
   "annotations": {
    "description": "node-3 检测到异常停止!请重点关注!!!",
    "summary": "node-3 已停止运行! alert"
   },
   "startsAt": "2020-08-20T07:09:35.987923059Z",
   "endsAt": "2020-08-20T07:14:05.987923059Z",
   "generatorURL": "http://test-1:9090/graph?g0.expr=up%7Bjob%3D%22centos-3%22%7D+%3D%3D+0\u0026g0.tab=1",
   "fingerprint": "d0412b7cebb1a039"
 }],
 "groupLabels": {
   "alertname": "node-up"
 },
 "commonLabels": {
   "alertname": "node-up",
   "instance": "node-3",
   "job": "centos-3",
   "severity": "1",
   "team": "node"
 },
 "commonAnnotations": {
   "description": "node-3 检测到异常停止!请重点关注!!!",
   "summary": "node-3 已停止运行! alert"
 },
 "externalURL": "http://test-1:9093",
 "version": "4",
 "groupKey": "{}:{alertname=\"node-up\"}",
 "truncatedAlerts": 0
}
二、告警规则
1.Prometheus
1
2
3
4
5
6
7
8
9
10
11
12
13
14
15
16
17
18
19
20
21
22
23
24
25
26
27
28
29
30
31
32
33
34
35
36
37
38
39
40
41
# 文件
prometheus.yml

groups:
- name: Prometheus   #报警规则组的名字
  rules:
  - alert: PrometheusTargetMissing
    expr: up == 0
    for: 1m
    labels:
      severity: critical
    annotations:
      summary: "Prometheus target missing (instance )"
      description: "A Prometheus target has disappeared. An exporter might be crashed.\n  VALUE = \n  LABELS: "

  - alert: PrometheusAllTargetsMissing
    expr: count by (job) (up) == 0
    for: 1m
    labels:
      severity: critical
    annotations:
      summary: "Prometheus all targets missing (instance )"
      description: "A Prometheus job does not have living target anymore.\n  VALUE = \n  LABELS: "

  - alert: PrometheusNotConnectedToAlertmanager
    expr: prometheus_notifications_alertmanagers_discovered < 1
    for: 1m
    labels:
      severity: critical
    annotations:
      summary: "Prometheus not connected to alertmanager (instance )"
      description: "Prometheus cannot connect the alertmanager\n  VALUE = \n  LABELS: "

  - alert: PrometheusAlertmanagerNotificationFailing
    expr: rate(alertmanager_notifications_failed_total[1m]) > 0
    for: 1m
    labels:
      severity: critical
    annotations:
      summary: "Prometheus AlertManager notification failing (instance )"
      description: "Alertmanager is failing sending notifications\n  VALUE = \n  LABELS: "
2.Linux
1
2
3
4
5
6
7
8
9
10
11
12
13
14
15
16
17
18
19
20
21
22
23
24
25
26
27
28
29
30
31
32
33
34
35
36
37
38
39
40
41
42
43
44
45
46
47
48
49
50
51
52
53
54
55
56
57
58
59
60
61
62
63
64
65
66
67
68
69
70
71
72
73
74
75
76
77
78
79
80
81
82
83
84
85
86
87
88
89
90
91
92
93
94
95
96
97
98
99
100
101
102
103
104
105
106
107
108
109
110
111
112
113
114
115
116
117
118
119
120
121
122
123
124
125
126
127
128
129
130
131
132
133
134
135
136
137
138
139
140
141
142
143
144
145
146
147
148
149
150
151
152
153
154
155
156
157
158
159
160
161
162
163
164
165
166
167
168
169
170
171
172
173
174
175
176
177
178
179
180
181
182
183
184
185
186
187
188
189
190
191
192
193
194
195
196
197
198
199
200
201
202
203
204
205
206
207
208
209
210
211
212
213
214
215
216
217
218
219
220
221
222
223
224
225
226
227
228
229
230
231
232
233
234
235
236
237
238
239
240
241
242
243
244
245
246
247
248
249
250
251
252
253
254
255
256
257
# 文件
node-exporter.yml

groups:
- name: CentOS   #报警规则组的名字
  rules:
  - alert: HostOutOfMemory
    expr: node_memory_MemAvailable_bytes / node_memory_MemTotal_bytes * 100 < 10
    for: 5m
    labels:
      severity: warning
    annotations:
      summary: "Host out of memory (instance )"
      description: "Node memory is filling up (< 10% left)\n  VALUE = \n  LABELS: "


  - alert: HostMemoryUnderMemoryPressure
    expr: rate(node_vmstat_pgmajfault[1m]) > 1000
    for: 5m
    labels:
      severity: warning
    annotations:
      summary: "Host memory under memory pressure (instance )"
      description: "The node is under heavy memory pressure. High rate of major page faults\n  VALUE = \n  LABELS: "


  - alert: HostUnusualNetworkThroughputIn
    expr: sum by (instance) (irate(node_network_receive_bytes_total[2m])) / 1024 / 1024 > 100
    for: 5m
    labels:
      severity: warning
    annotations:
      summary: "Host unusual network throughput in (instance )"
      description: "Host network interfaces are probably receiving too much data (> 100 MB/s)\n  VALUE = \n  LABELS: "


  - alert: HostUnusualNetworkThroughputOut
    expr: sum by (instance) (irate(node_network_transmit_bytes_total[2m])) / 1024 / 1024 > 100
    for: 5m
    labels:
      severity: warning
    annotations:
      summary: "Host unusual network throughput out (instance )"
      description: "Host network interfaces are probably sending too much data (> 100 MB/s)\n  VALUE = \n  LABELS: "


  - alert: HostUnusualDiskReadRate
    expr: sum by (instance) (irate(node_disk_read_bytes_total[2m])) / 1024 / 1024 > 50
    for: 5m
    labels:
      severity: warning
    annotations:
      summary: "Host unusual disk read rate (instance )"
      description: "Disk is probably reading too much data (> 50 MB/s)\n  VALUE = \n  LABELS: "


  - alert: HostUnusualDiskWriteRate
    expr: sum by (instance) (irate(node_disk_written_bytes_total[2m])) / 1024 / 1024 > 50
    for: 5m
    labels:
      severity: warning
    annotations:
      summary: "Host unusual disk write rate (instance )"
      description: "Disk is probably writing too much data (> 50 MB/s)\n  VALUE = \n  LABELS: "


  - alert: HostOutOfDiskSpace
    expr: (node_filesystem_avail_bytes{mountpoint="/rootfs"}  * 100) / node_filesystem_size_bytes{mountpoint="/rootfs"} < 10
    for: 5m
    labels:
      severity: warning
    annotations:
      summary: "Host out of disk space (instance )"
      description: "Disk is almost full (< 10% left)\n  VALUE = \n  LABELS: "


  - alert: HostDiskWillFillIn4Hours
    expr: predict_linear(node_filesystem_free_bytes{fstype!~"tmpfs"}[1h], 4 * 3600) < 0
    for: 5m
    labels:
      severity: warning
    annotations:
      summary: "Host disk will fill in 4 hours (instance )"
      description: "Disk will fill in 4 hours at current write rate\n  VALUE = \n  LABELS: "


  - alert: HostOutOfInodes
    expr: node_filesystem_files_free{mountpoint ="/rootfs"} / node_filesystem_files{mountpoint ="/rootfs"} * 100 < 10
    for: 5m
    labels:
      severity: warning
    annotations:
      summary: "Host out of inodes (instance )"
      description: "Disk is almost running out of available inodes (< 10% left)\n  VALUE = \n LABELS: "


  - alert: HostUnusualDiskReadLatency
    expr: rate(node_disk_read_time_seconds_total[1m]) / rate(node_disk_reads_completed_total[1m]) > 100
    for: 5m
    labels:
      severity: warning
    annotations:
      summary: "Host unusual disk read latency (instance )"
      description: "Disk latency is growing (read operations > 100ms)\n  VALUE = \n  LABELS: "


  - alert: HostUnusualDiskWriteLatency
    expr: rate(node_disk_write_time_seconds_total[1m]) / rate(node_disk_writes_completed_total[1m]) > 100
    for: 5m
    labels:
      severity: warning
    annotations:
      summary: "Host unusual disk write latency (instance )"
      description: "Disk latency is growing (write operations > 100ms)\n  VALUE = \n  LABELS: "


  - alert: HostHighCpuLoad
    expr: 100 - (avg by(instance) (irate(node_cpu_seconds_total{mode="idle"}[5m])) * 100) > 80
    for: 5m
    labels:
      severity: warning
    annotations:
      summary: "Host high CPU load (instance )"
      description: "CPU load is > 80%\n  VALUE = \n  LABELS: "


  # 1000 context switches is an arbitrary number.
  # Alert threshold depends on nature of application.
  # Please read: https://github.com/samber/awesome-prometheus-alerts/issues/58
  - alert: HostContextSwitching
    expr: (rate(node_context_switches_total[5m])) / (count without(cpu, mode) (node_cpu_seconds_total{mode="idle"})) > 1000
    for: 5m
    labels:
      severity: warning
    annotations:
      summary: "Host context switching (instance )"
      description: "Context switching is growing on node (> 1000 / s)\n  VALUE = \n  LABELS: "


  - alert: HostSwapIsFillingUp
    expr: (1 - (node_memory_SwapFree_bytes / node_memory_SwapTotal_bytes)) * 100 > 80
    for: 5m
    labels:
      severity: warning
    annotations:
      summary: "Host swap is filling up (instance )"
      description: "Swap is filling up (>80%)\n  VALUE = \n  LABELS: "


  - alert: HostSystemdServiceCrashed
    expr: node_systemd_unit_state{state="failed"} == 1
    for: 5m
    labels:
      severity: warning
    annotations:
      summary: "Host SystemD service crashed (instance )"
      description: "SystemD service crashed\n  VALUE = \n  LABELS: "


  - alert: HostPhysicalComponentTooHot
    expr: node_hwmon_temp_celsius > 75
    for: 5m
    labels:
      severity: warning
    annotations:
      summary: "Host physical component too hot (instance )"
      description: "Physical hardware component too hot\n  VALUE = \n  LABELS: "


  - alert: HostNodeOvertemperatureAlarm
    expr: node_hwmon_temp_alarm == 1
    for: 5m
    labels:
      severity: critical
    annotations:
      summary: "Host node overtemperature alarm (instance )"
      description: "Physical node temperature alarm triggered\n  VALUE = \n  LABELS: "


  - alert: HostRaidArrayGotInactive
    expr: node_md_state{state="inactive"} > 0
    for: 5m
    labels:
      severity: critical
    annotations:
      summary: "Host RAID array got inactive (instance )"
      description: "RAID array  is in degraded state due to one or more disks failures. Number of spare drives is insufficient to fix issue automatically.\n  VALUE = \n  LABELS: "


  - alert: HostRaidDiskFailure
    expr: node_md_disks{state="fail"} > 0
    for: 5m
    labels:
      severity: warning
    annotations:
      summary: "Host RAID disk failure (instance )"
      description: "At least one device in RAID array on  failed. Array  needs attention and possibly a disk swap\n  VALUE = \n  LABELS: "


  - alert: HostKernelVersionDeviations
    expr: count(sum(label_replace(node_uname_info, "kernel", "$1", "release", "([0-9]+.[0-9]+.[0-9]+).*")) by (kernel)) > 1
    for: 5m
    labels:
      severity: warning
    annotations:
      summary: "Host kernel version deviations (instance )"
      description: "Different kernel versions are running\n  VALUE = \n  LABELS: "


  - alert: HostOomKillDetected
    expr: increase(node_vmstat_oom_kill[5m]) > 0
    for: 5m
    labels:
      severity: warning
    annotations:
      summary: "Host OOM kill detected (instance )"
      description: "OOM kill detected\n  VALUE = \n  LABELS: "


  - alert: HostEdacCorrectableErrorsDetected
    expr: increase(node_edac_correctable_errors_total[5m]) > 0
    for: 5m
    labels:
      severity: info
    annotations:
      summary: "Host EDAC Correctable Errors detected (instance )"
      description: " has had  correctable memory errors reported by EDAC in the last 5 minutes.\n  VALUE = \n  LABELS: "


  - alert: HostEdacUncorrectableErrorsDetected
    expr: node_edac_uncorrectable_errors_total > 0
    for: 5m
    labels:
      severity: warning
    annotations:
      summary: "Host EDAC Uncorrectable Errors detected (instance )"
      description: " has had  uncorrectable memory errors reported by EDAC in the last 5 minutes.\n  VALUE = \n  LABELS: "


  - alert: HostNetworkReceiveErrors
    expr: increase(node_network_receive_errs_total[5m]) > 0
    for: 5m
    labels:
      severity: warning
    annotations:
      summary: "Host Network Receive Errors (instance )"
      description: " interface  has encountered  receive errors in the last five minutes.\n  VALUE = \n  LABELS: "


  - alert: HostNetworkTransmitErrors
    expr: increase(node_network_transmit_errs_total[5m]) > 0
    for: 5m
    labels:
      severity: warning
    annotations:
      summary: "Host Network Transmit Errors (instance )"
      description: " interface  has encountered  transmit errors in the last five minutes.\n  VALUE = \n  LABELS: "
3.Docker
1
2
3
4
5
6
7
8
9
10
11
12
13
14
15
16
17
18
19
20
21
22
23
24
25
26
27
28
29
30
31
32
33
34
35
36
37
38
39
40
41
42
43
44
45
46
47
48
49
50
51
52
53
54
55
56
57
58
59
60
61
62
63
64
# 文件
cadvisor.yml

groups:
- name: Docker   #报警规则组的名字
  rules:
  - alert: ContainerKilled
    expr: time() - container_last_seen > 60
    for: 5m
    labels:
      severity: warning
    annotations:
      summary: "Container killed (instance )"
      description: "A container has disappeared\n  VALUE = \n  LABELS: "


  - alert: ContainerCpuUsage
    expr: (sum(rate(container_cpu_usage_seconds_total[3m])) BY (instance, name) * 100) > 80
    for: 5m
    labels:
      severity: warning
    annotations:
      summary: "Container CPU usage (instance )"
      description: "Container CPU usage is above 80%\n  VALUE = \n  LABELS: "


  - alert: ContainerMemoryUsage
    expr: (sum(container_memory_usage_bytes) BY (instance, name) / sum(container_spec_memory_limit_bytes) BY (instance, name) * 100) > 80
    for: 5m
    labels:
      severity: warning
    annotations:
      summary: "Container Memory usage (instance )"
      description: "Container Memory usage is above 80%\n  VALUE = \n  LABELS: "


  - alert: ContainerVolumeUsage
    expr: (1 - (sum(container_fs_inodes_free) BY (instance) / sum(container_fs_inodes_total) BY (instance)) * 100) > 80
    for: 5m
    labels:
      severity: warning
    annotations:
      summary: "Container Volume usage (instance )"
      description: "Container Volume usage is above 80%\n  VALUE = \n  LABELS: "


  - alert: ContainerVolumeIoUsage
    expr: (sum(container_fs_io_current) BY (instance, name) * 100) > 80
    for: 5m
    labels:
      severity: warning
    annotations:
      summary: "Container Volume IO usage (instance )"
      description: "Container Volume IO usage is above 80%\n  VALUE = \n  LABELS: "


  - alert: ContainerHighThrottleRate
    expr: rate(container_cpu_cfs_throttled_seconds_total[3m]) > 1
    for: 5m
    labels:
      severity: warning
    annotations:
      summary: "Container high throttle rate (instance )"
      description: "Container is being throttled\n  VALUE = \n  LABELS: "
4.Nginx
1
2
3
4
5
6
7
8
9
10
11
12
13
14
15
16
17
18
19
20
21
22
23
24
25
26
27
28
29
30
31
32
33
34
# 文件
nginx-vts-exporter.yml

groups:
- name: Nginx   #报警规则组的名字
  rules:
  - alert: NginxHighHttp4xxErrorRate
    expr: sum(rate(nginx_http_requests_total{status=~"^4.."}[1m])) / sum(rate(nginx_http_requests_total[1m])) * 100 > 5
    for: 5m
    labels:
      severity: critical
    annotations:
      summary: "Nginx high HTTP 4xx error rate (instance )"
      description: "Too many HTTP requests with status 4xx (> 5%)\n  VALUE = \n  LABELS: "


  - alert: NginxHighHttp5xxErrorRate
    expr: sum(rate(nginx_http_requests_total{status=~"^5.."}[1m])) / sum(rate(nginx_http_requests_total[1m])) * 100 > 5
    for: 5m
    labels:
      severity: critical
    annotations:
      summary: "Nginx high HTTP 5xx error rate (instance )"
      description: "Too many HTTP requests with status 5xx (> 5%)\n  VALUE = \n  LABELS: "


  - alert: NginxLatencyHigh
    expr: histogram_quantile(0.99, sum(rate(nginx_http_request_duration_seconds_bucket[30m])) by (host, node)) > 10
    for: 5m
    labels:
      severity: warning
    annotations:
      summary: "Nginx latency high (instance )"
      description: "Nginx p99 latency is higher than 10 seconds\n  VALUE = \n  LABELS: "
5.Redis
1
2
3
4
5
6
7
8
9
10
11
12
13
14
15
16
17
18
19
20
21
22
23
24
25
26
27
28
29
30
31
32
33
34
35
36
37
38
39
40
41
42
43
44
45
46
47
48
49
50
51
52
53
54
55
56
57
58
59
60
61
62
63
64
65
66
67
68
69
70
71
72
73
74
75
76
77
78
79
80
81
82
83
84
85
86
87
88
89
90
91
92
93
94
95
96
97
98
99
100
101
102
103
104
105
106
107
108
109
110
111
112
113
114
# 文件
redis-exporter.yml

groups:
- name: Redis   #报警规则组的名字
  rules:
  - alert: RedisDown
    expr: redis_up == 0
    for: 5m
    labels:
      severity: critical
    annotations:
      summary: "Redis down (instance )"
      description: "Redis instance is down\n  VALUE = \n  LABELS: "


  - alert: RedisMissingMaster
    expr: count(redis_instance_info{role="master"}) == 0
    for: 5m
    labels:
      severity: critical
    annotations:
      summary: "Redis missing master (instance )"
      description: "Redis cluster has no node marked as master.\n  VALUE = \n  LABELS: "


  - alert: RedisTooManyMasters
    expr: count(redis_instance_info{role="master"}) > 1
    for: 5m
    labels:
      severity: critical
    annotations:
      summary: "Redis too many masters (instance )"
      description: "Redis cluster has too many nodes marked as master.\n  VALUE = \n  LABELS: "


  - alert: RedisDisconnectedSlaves
    expr: count without (instance, job) (redis_connected_slaves) - sum without (instance, job) (redis_connected_slaves) - 1 > 1
    for: 5m
    labels:
      severity: critical
    annotations:
      summary: "Redis disconnected slaves (instance )"
      description: "Redis not replicating for all slaves. Consider reviewing the redis replication status.\n  VALUE = \n  LABELS: "


  - alert: RedisReplicationBroken
    expr: delta(redis_connected_slaves[1m]) < 0
    for: 5m
    labels:
      severity: critical
    annotations:
      summary: "Redis replication broken (instance )"
      description: "Redis instance lost a slave\n  VALUE = \n  LABELS: "


  - alert: RedisClusterFlapping
    expr: changes(redis_connected_slaves[5m]) > 2
    for: 5m
    labels:
      severity: critical
    annotations:
      summary: "Redis cluster flapping (instance )"
      description: "Changes have been detected in Redis replica connection. This can occur when replica nodes lose connection to the master and reconnect (a.k.a flapping).\n  VALUE = \n  LABELS: "


  - alert: RedisMissingBackup
    expr: time() - redis_rdb_last_save_timestamp_seconds > 60 * 60 * 24
    for: 5m
    labels:
      severity: critical
    annotations:
      summary: "Redis missing backup (instance )"
      description: "Redis has not been backuped for 24 hours\n  VALUE = \n  LABELS: "


  - alert: RedisOutOfMemory
    expr: redis_memory_used_bytes / redis_total_system_memory_bytes * 100 > 90
    for: 5m
    labels:
      severity: warning
    annotations:
      summary: "Redis out of memory (instance )"
      description: "Redis is running out of memory (> 90%)\n  VALUE = \n  LABELS: "


  - alert: RedisTooManyConnections
    expr: redis_connected_clients > 100
    for: 5m
    labels:
      severity: warning
    annotations:
      summary: "Redis too many connections (instance )"
      description: "Redis instance has too many connections\n  VALUE = \n  LABELS: "


  - alert: RedisNotEnoughConnections
    expr: redis_connected_clients < 5
    for: 5m
    labels:
      severity: warning
    annotations:
      summary: "Redis not enough connections (instance )"
      description: "Redis instance should have more connections (> 5)\n  VALUE = \n  LABELS: "


  - alert: RedisRejectedConnections
    expr: increase(redis_rejected_connections_total[1m]) > 0
    for: 5m
    labels:
      severity: critical
    annotations:
      summary: "Redis rejected connections (instance )"
      description: "Some connections to Redis has been rejected\n  VALUE = \n  LABELS: "
6.PostgreSQL
1
2
3
4
5
6
7
8
9
10
11
12
13
14
15
16
17
18
19
20
21
22
23
24
25
26
27
28
29
30
31
32
33
34
35
36
37
38
39
40
41
42
43
44
45
46
47
48
49
50
51
52
53
54
55
56
57
58
59
60
61
62
63
64
65
66
67
68
69
70
71
72
73
74
75
76
77
78
79
80
81
82
83
84
85
86
87
88
89
90
91
92
93
94
95
96
97
98
99
100
101
102
103
104
105
106
107
108
109
110
111
112
113
114
115
116
117
118
119
120
121
122
123
124
125
126
127
128
129
130
131
132
133
134
135
136
137
138
139
140
141
142
143
144
145
146
147
148
149
150
151
152
153
154
155
156
157
158
159
160
161
162
163
164
165
166
167
168
169
170
171
172
173
174
175
176
177
178
179
180
181
182
183
184
185
186
187
188
189
190
191
192
193
194
195
196
197
198
199
200
201
202
203
204
205
206
207
208
209
210
211
212
213
214
215
216
217
218
219
220
221
222
223
224
225
226
227
228
229
230
231
232
233
234
235
236
237
238
239
240
241
242
243
244
245
246
247
248
249
250
251
252
253
254
# 文件
postgres-exporter.yml

groups:
- name: PostgreSQL   #报警规则组的名字
  rules:
  - alert: PostgresqlDown
    expr: pg_up == 0
    for: 5m
    labels:
      severity: critical
    annotations:
      summary: "Postgresql down (instance )"
      description: "Postgresql instance is down\n  VALUE = \n  LABELS: "


  - alert: PostgresqlRestarted
    expr: time() - pg_postmaster_start_time_seconds < 60
    for: 5m
    labels:
      severity: critical
    annotations:
      summary: "Postgresql restarted (instance )"
      description: "Postgresql restarted\n  VALUE = \n  LABELS: "


  - alert: PostgresqlExporterError
    expr: pg_exporter_last_scrape_error > 0
    for: 5m
    labels:
      severity: warning
    annotations:
      summary: "Postgresql exporter error (instance )"
      description: "Postgresql exporter is showing errors. A query may be buggy in query.yaml\n  VALUE = \n  LABELS: "


  - alert: PostgresqlReplicationLag
    expr: (pg_replication_lag) > 10 and ON(instance) (pg_replication_is_replica == 1)
    for: 5m
    labels:
      severity: warning
    annotations:
      summary: "Postgresql replication lag (instance )"
      description: "PostgreSQL replication lag is going up (> 10s)\n  VALUE = \n  LABELS: "


  - alert: PostgresqlTableNotVaccumed
    expr: time() - pg_stat_user_tables_last_autovacuum > 60 * 60 * 24
    for: 5m
    labels:
      severity: warning
    annotations:
      summary: "Postgresql table not vaccumed (instance )"
      description: "Table has not been vaccum for 24 hours\n  VALUE = \n  LABELS: "


  - alert: PostgresqlTableNotAnalyzed
    expr: time() - pg_stat_user_tables_last_autoanalyze > 60 * 60 * 24
    for: 5m
    labels:
      severity: warning
    annotations:
      summary: "Postgresql table not analyzed (instance )"
      description: "Table has not been analyzed for 24 hours\n  VALUE = \n  LABELS: "


  - alert: PostgresqlTooManyConnections
    expr: sum by (datname) (pg_stat_activity_count{datname!~"template.*|postgres"}) > pg_settings_max_connections * 0.9
    for: 5m
    labels:
      severity: warning
    annotations:
      summary: "Postgresql too many connections (instance )"
      description: "PostgreSQL instance has too many connections\n  VALUE = \n  LABELS: "


  - alert: PostgresqlNotEnoughConnections
    expr: sum by (datname) (pg_stat_activity_count{datname!~"template.*|postgres"}) < 5
    for: 5m
    labels:
      severity: warning
    annotations:
      summary: "Postgresql not enough connections (instance )"
      description: "PostgreSQL instance should have more connections (> 5)\n  VALUE = \n  LABELS: "


  - alert: PostgresqlDeadLocks
    expr: rate(pg_stat_database_deadlocks{datname!~"template.*|postgres"}[1m]) > 0
    for: 5m
    labels:
      severity: warning
    annotations:
      summary: "Postgresql dead locks (instance )"
      description: "PostgreSQL has dead-locks\n  VALUE = \n  LABELS: "


  - alert: PostgresqlSlowQueries
    expr: pg_slow_queries > 0
    for: 5m
    labels:
      severity: warning
    annotations:
      summary: "Postgresql slow queries (instance )"
      description: "PostgreSQL executes slow queries\n  VALUE = \n  LABELS: "


  - alert: PostgresqlHighRollbackRate
    expr: rate(pg_stat_database_xact_rollback{datname!~"template.*"}[3m]) / rate(pg_stat_database_xact_commit{datname!~"template.*"}[3m]) > 0.02
    for: 5m
    labels:
      severity: warning
    annotations:
      summary: "Postgresql high rollback rate (instance )"
      description: "Ratio of transactions being aborted compared to committed is > 2 %\n  VALUE = \n  LABELS: "


  - alert: PostgresqlCommitRateLow
    expr: rate(pg_stat_database_xact_commit[1m]) < 10
    for: 5m
    labels:
      severity: critical
    annotations:
      summary: "Postgresql commit rate low (instance )"
      description: "Postgres seems to be processing very few transactions\n  VALUE = \n  LABELS: "


  - alert: PostgresqlLowXidConsumption
    expr: rate(pg_txid_current[1m]) < 5
    for: 5m
    labels:
      severity: warning
    annotations:
      summary: "Postgresql low XID consumption (instance )"
      description: "Postgresql seems to be consuming transaction IDs very slowly\n  VALUE = \n  LABELS: "


  - alert: PostgresqllowXlogConsumption
    expr: rate(pg_xlog_position_bytes[1m]) < 100
    for: 5m
    labels:
      severity: warning
    annotations:
      summary: "Postgresqllow XLOG consumption (instance )"
      description: "Postgres seems to be consuming XLOG very slowly\n  VALUE = \n  LABELS: "


  - alert: PostgresqlWaleReplicationStopped
    expr: rate(pg_xlog_position_bytes[1m]) == 0
    for: 5m
    labels:
      severity: critical
    annotations:
      summary: "Postgresql WALE replication stopped (instance )"
      description: "WAL-E replication seems to be stopped\n  VALUE = \n  LABELS: "


  - alert: PostgresqlHighRateStatementTimeout
    expr: rate(postgresql_errors_total{type="statement_timeout"}[5m]) > 3
    for: 5m
    labels:
      severity: critical
    annotations:
      summary: "Postgresql high rate statement timeout (instance )"
      description: "Postgres transactions showing high rate of statement timeouts\n  VALUE = \n  LABELS: "


  - alert: PostgresqlHighRateDeadlock
    expr: rate(postgresql_errors_total{type="deadlock_detected"}[1m]) * 60 > 1
    for: 5m
    labels:
      severity: critical
    annotations:
      summary: "Postgresql high rate deadlock (instance )"
      description: "Postgres detected deadlocks\n  VALUE = \n  LABELS: "


  - alert: PostgresqlReplicationLabBytes
    expr: (pg_xlog_position_bytes and pg_replication_is_replica == 0) - GROUP_RIGHT(instance) (pg_xlog_position_bytes and pg_replication_is_replica == 1) > 1e+09
    for: 5m
    labels:
      severity: critical
    annotations:
      summary: "Postgresql replication lab bytes (instance )"
      description: "Postgres Replication lag (in bytes) is high\n  VALUE = \n  LABELS: "


  - alert: PostgresqlUnusedReplicationSlot
    expr: pg_replication_slots_active == 0
    for: 5m
    labels:
      severity: warning
    annotations:
      summary: "Postgresql unused replication slot (instance )"
      description: "Unused Replication Slots\n  VALUE = \n  LABELS: "


  - alert: PostgresqlTooManyDeadTuples
    expr: ((pg_stat_user_tables_n_dead_tup > 10000) / (pg_stat_user_tables_n_live_tup + pg_stat_user_tables_n_dead_tup)) >= 0.1 unless ON(instance) (pg_replication_is_replica == 1)
    for: 5m
    labels:
      severity: warning
    annotations:
      summary: "Postgresql too many dead tuples (instance )"
      description: "PostgreSQL dead tuples is too large\n  VALUE = \n  LABELS: "


  - alert: PostgresqlSplitBrain
    expr: count(pg_replication_is_replica == 0) != 1
    for: 5m
    labels:
      severity: critical
    annotations:
      summary: "Postgresql split brain (instance )"
      description: "Split Brain, too many primary Postgresql databases in read-write mode\n  VALUE = \n  LABELS: "


  - alert: PostgresqlPromotedNode
    expr: pg_replication_is_replica and changes(pg_replication_is_replica[1m]) > 0
    for: 5m
    labels:
      severity: warning
    annotations:
      summary: "Postgresql promoted node (instance )"
      description: "Postgresql standby server has been promoted as primary node\n  VALUE = \n LABELS: "


  - alert: PostgresqlConfigurationChanged
    expr: {__name__=~"pg_settings_.*"} != ON(__name__) {__name__=~"pg_settings_([^t]|t[^r]|tr[^a]|tra[^n]|tran[^s]|trans[^a]|transa[^c]|transac[^t]|transact[^i]|transacti[^o]|transactio[^n]|transaction[^_]|transaction_[^r]|transaction_r[^e]|transaction_re[^a]|transaction_rea[^d]|transaction_read[^_]|transaction_read_[^o]|transaction_read_o[^n]|transaction_read_on[^l]|transaction_read_onl[^y]).*"} OFFSET 5m
    for: 5m
    labels:
      severity: warning
    annotations:
      summary: "Postgresql configuration changed (instance )"
      description: "Postgres Database configuration change has occurred\n  VALUE = \n  LABELS: "


  - alert: PostgresqlSslCompressionActive
    expr: sum(pg_stat_ssl_compression) > 0
    for: 5m
    labels:
      severity: critical
    annotations:
      summary: "Postgresql SSL compression active (instance )"
      description: "Database connections with SSL compression enabled. This may add significant jitter in replication delay. Replicas should turn off SSL compression via `sslcompression=0` in `recovery.conf`.\n  VALUE = \n  LABELS: "


  - alert: PostgresqlTooManyLocksAcquired
    expr: ((sum (pg_locks_count)) / (pg_settings_max_locks_per_transaction * pg_settings_max_connections)) > 0.20
    for: 5m
    labels:
      severity: critical
    annotations:
      summary: "Postgresql too many locks acquired (instance )"
      description: "Too many locks acquired on the database. If this alert happens frequently, we may need to increase the postgres setting max_locks_per_transaction.\n  VALUE = \n  LABELS: "
7.MySQL
1
2
3
4
5
6
7
8
9
10
11
12
13
14
15
16
17
18
19
20
21
22
23
24
25
26
27
28
29
30
31
32
33
34
35
36
37
38
39
40
41
42
43
44
45
46
47
48
49
50
51
52
53
54
55
56
57
58
59
60
61
62
63
64
65
66
67
68
69
70
71
72
73
74
75
76
77
78
79
80
81
82
83
84
# 文件
mysqld-exporter.yml

groups:
- name: MySQL   #报警规则组的名字
  rules:
  - alert: MysqlDown
    expr: mysql_up == 0
    for: 5m
    labels:
      severity: critical
    annotations:
      summary: "MySQL down (instance )"
      description: "MySQL instance is down on \n  VALUE = \n  LABELS: "


  - alert: MysqlTooManyConnections
    expr: avg by (instance) (max_over_time(mysql_global_status_threads_connected[5m])) / avg by (instance) (mysql_global_variables_max_connections) * 100 > 80
    for: 5m
    labels:
      severity: warning
    annotations:
      summary: "MySQL too many connections (instance )"
      description: "More than 80% of MySQL connections are in use on \n  VALUE = \n  LABELS: "


  - alert: MysqlHighThreadsRunning
    expr: avg by (instance) (max_over_time(mysql_global_status_threads_running[5m])) / avg by (instance) (mysql_global_variables_max_connections) * 100 > 60
    for: 5m
    labels:
      severity: warning
    annotations:
      summary: "MySQL high threads running (instance )"
      description: "More than 60% of MySQL connections are in running state on \n  VALUE = \n  LABELS: "


  - alert: MysqlSlaveIoThreadNotRunning
    expr: mysql_slave_status_master_server_id > 0 and ON (instance) mysql_slave_status_slave_io_running == 0
    for: 5m
    labels:
      severity: critical
    annotations:
      summary: "MySQL Slave IO thread not running (instance )"
      description: "MySQL Slave IO thread not running on \n  VALUE = \n LABELS: "


  - alert: MysqlSlaveSqlThreadNotRunning
    expr: mysql_slave_status_master_server_id > 0 and ON (instance) mysql_slave_status_slave_sql_running == 0
    for: 5m
    labels:
      severity: critical
    annotations:
      summary: "MySQL Slave SQL thread not running (instance )"
      description: "MySQL Slave SQL thread not running on \n  VALUE = \n  LABELS: "


  - alert: MysqlSlaveReplicationLag
    expr: mysql_slave_status_master_server_id > 0 and ON (instance) (mysql_slave_status_seconds_behind_master - mysql_slave_status_sql_delay) > 300
    for: 5m
    labels:
      severity: warning
    annotations:
      summary: "MySQL Slave replication lag (instance )"
      description: "MysqL replication lag on \n  VALUE = \n  LABELS: "


  - alert: MysqlSlowQueries
    expr: mysql_global_status_slow_queries > 0
    for: 5m
    labels:
      severity: warning
    annotations:
      summary: "MySQL slow queries (instance )"
      description: "MySQL server is having some slow queries.\n  VALUE = \n  LABELS: "


  - alert: MysqlRestarted
    expr: mysql_global_status_uptime < 60
    for: 5m
    labels:
      severity: warning
    annotations:
      summary: "MySQL restarted (instance )"
      description: "MySQL has just been restarted, less than one minute ago on .\n  VALUE = \n  LABELS: "
8.RabbitMQ
1
2
3
4
5
6
7
8
9
10
11
12
13
14
15
16
17
18
19
20
21
22
23
24
25
26
27
28
29
30
31
32
33
34
35
36
37
38
39
40
41
42
43
44
45
46
47
48
49
50
51
52
53
54
55
56
57
58
59
60
61
62
63
64
65
66
67
68
69
70
71
72
73
74
75
76
77
78
79
80
81
82
83
84
85
86
87
88
89
90
91
92
93
94
95
96
97
98
99
100
101
102
103
104
105
106
107
108
109
110
111
112
113
114
115
# 文件
rabbitmq-exporter.yml

groups:
- name: Rabbitmq   #报警规则组的名字
  rules:
  - alert: RabbitmqDown
    expr: rabbitmq_up == 0
    for: 5m
    labels:
      severity: critical
    annotations:
      summary: "Rabbitmq down (instance )"
      description: "RabbitMQ node down\n  VALUE = \n  LABELS: "


  - alert: RabbitmqClusterDown
    expr: sum(rabbitmq_running) < 3
    for: 5m
    labels:
      severity: critical
    annotations:
      summary: "Rabbitmq cluster down (instance )"
      description: "Less than 3 nodes running in RabbitMQ cluster\n  VALUE = \n  LABELS: "


  - alert: RabbitmqClusterPartition
    expr: rabbitmq_partitions > 0
    for: 5m
    labels:
      severity: critical
    annotations:
      summary: "Rabbitmq cluster partition (instance )"
      description: "Cluster partition\n  VALUE = \n  LABELS: "


  - alert: RabbitmqOutOfMemory
    expr: rabbitmq_node_mem_used / rabbitmq_node_mem_limit * 100 > 90
    for: 5m
    labels:
      severity: warning
    annotations:
      summary: "Rabbitmq out of memory (instance )"
      description: "Memory available for RabbmitMQ is low (< 10%)\n  VALUE = \n  LABELS: "


  - alert: RabbitmqTooManyConnections
    expr: rabbitmq_connectionsTotal > 1000
    for: 5m
    labels:
      severity: warning
    annotations:
      summary: "Rabbitmq too many connections (instance )"
      description: "RabbitMQ instance has too many connections (> 1000)\n  VALUE = \n  LABELS: "


  - alert: RabbitmqDeadLetterQueueFillingUp
    expr: rabbitmq_queue_messages{queue="my-dead-letter-queue"} > 10
    for: 5m
    labels:
      severity: critical
    annotations:
      summary: "Rabbitmq dead letter queue filling up (instance )"
      description: "Dead letter queue is filling up (> 10 msgs)\n  VALUE = \n  LABELS: "


  - alert: RabbitmqTooManyMessagesInQueue
    expr: rabbitmq_queue_messages_ready{queue="my-queue"} > 1000
    for: 5m
    labels:
      severity: warning
    annotations:
      summary: "Rabbitmq too many messages in queue (instance )"
      description: "Queue is filling up (> 1000 msgs)\n  VALUE = \n  LABELS: "


  - alert: RabbitmqSlowQueueConsuming
    expr: time() - rabbitmq_queue_head_message_timestamp{queue="my-queue"} > 60
    for: 5m
    labels:
      severity: warning
    annotations:
      summary: "Rabbitmq slow queue consuming (instance )"
      description: "Queue messages are consumed slowly (> 60s)\n  VALUE = \n  LABELS: "


  - alert: RabbitmqNoConsumer
    expr: rabbitmq_queue_consumers == 0
    for: 5m
    labels:
      severity: critical
    annotations:
      summary: "Rabbitmq no consumer (instance )"
      description: "Queue has no consumer\n  VALUE = \n  LABELS: "


  - alert: RabbitmqTooManyConsumers
    expr: rabbitmq_queue_consumers > 1
    for: 5m
    labels:
      severity: critical
    annotations:
      summary: "Rabbitmq too many consumers (instance )"
      description: "Queue should have only 1 consumer\n  VALUE = \n  LABELS: "


  - alert: RabbitmqUnactiveExchange
    expr: rate(rabbitmq_exchange_messages_published_in_total{exchange="my-exchange"}[1m]) < 5
    for: 5m
    labels:
      severity: warning
    annotations:
      summary: "Rabbitmq unactive exchange (instance )"
      description: "Exchange receive less than 5 msgs per second\n  VALUE = \n  LABELS: "
9.JVM
1
2
3
4
5
6
7
8
9
10
11
12
13
14
# 文件
jvm.yml

groups:
- name: JVM   #报警规则组的名字
  rules:
  - alert: JvmMemoryFillingUp
    expr: jvm_memory_bytes_used / jvm_memory_bytes_max{area="heap"} > 0.8
    for: 5m
    labels:
      severity: warning
    annotations:
      summary: "JVM memory filling up (instance )"
      description: "JVM memory is filling up (> 80%)\n  VALUE = \n  LABELS: "
10.Elasticsearch
1
2
3
4
5
6
7
8
9
10
11
12
13
14
15
16
17
18
19
20
21
22
23
24
25
26
27
28
29
30
31
32
33
34
35
36
37
38
39
40
41
42
43
44
45
46
47
48
49
50
51
52
53
54
55
56
57
58
59
60
61
62
63
64
65
66
67
68
69
70
71
72
73
74
75
76
77
78
79
80
81
82
83
84
85
86
87
88
89
90
91
92
93
94
95
96
97
98
99
100
101
102
103
104
105
106
107
108
109
110
111
112
113
114
115
116
117
118
119
120
121
122
123
124
125
126
127
128
129
130
131
132
133
# 文件
elasticsearch-exporter.yml

groups:
- name: Elasticsearch   #报警规则组的名字
  rules:
  - alert: ElasticsearchHeapUsageTooHigh
    expr: (elasticsearch_jvm_memory_used_bytes{area="heap"} / elasticsearch_jvm_memory_max_bytes{area="heap"}) * 100 > 90
    for: 5m
    labels:
      severity: critical
    annotations:
      summary: "Elasticsearch Heap Usage Too High (instance )"
      description: "The heap usage is over 90% for 5m\n  VALUE = \n  LABELS: "


  - alert: ElasticsearchHeapUsageWarning
    expr: (elasticsearch_jvm_memory_used_bytes{area="heap"} / elasticsearch_jvm_memory_max_bytes{area="heap"}) * 100 > 80
    for: 5m
    labels:
      severity: warning
    annotations:
      summary: "Elasticsearch Heap Usage warning (instance )"
      description: "The heap usage is over 80% for 5m\n  VALUE = \n  LABELS: "


  - alert: ElasticsearchDiskSpaceLow
    expr: elasticsearch_filesystem_data_available_bytes / elasticsearch_filesystem_data_size_bytes * 100 < 20
    for: 5m
    labels:
      severity: warning
    annotations:
      summary: "Elasticsearch disk space low (instance )"
      description: "The disk usage is over 80%\n  VALUE = \n  LABELS: "


  - alert: ElasticsearchDiskOutOfSpace
    expr: elasticsearch_filesystem_data_available_bytes / elasticsearch_filesystem_data_size_bytes * 100 < 10
    for: 5m
    labels:
      severity: critical
    annotations:
      summary: "Elasticsearch disk out of space (instance )"
      description: "The disk usage is over 90%\n  VALUE = \n  LABELS: "


  - alert: ElasticsearchClusterRed
    expr: elasticsearch_cluster_health_status{color="red"} == 1
    for: 5m
    labels:
      severity: critical
    annotations:
      summary: "Elasticsearch Cluster Red (instance )"
      description: "Elastic Cluster Red status\n  VALUE = \n  LABELS: "


  - alert: ElasticsearchClusterYellow
    expr: elasticsearch_cluster_health_status{color="yellow"} == 1
    for: 5m
    labels:
      severity: warning
    annotations:
      summary: "Elasticsearch Cluster Yellow (instance )"
      description: "Elastic Cluster Yellow status\n  VALUE = \n  LABELS: "


  - alert: ElasticsearchHealthyNodes
    expr: elasticsearch_cluster_health_number_of_nodes < number_of_nodes
    for: 5m
    labels:
      severity: critical
    annotations:
      summary: "Elasticsearch Healthy Nodes (instance )"
      description: "Number Healthy Nodes less then number_of_nodes\n  VALUE = \n  LABELS: "


  - alert: ElasticsearchHealthyDataNodes
    expr: elasticsearch_cluster_health_number_of_data_nodes < number_of_data_nodes
    for: 5m
    labels:
      severity: critical
    annotations:
      summary: "Elasticsearch Healthy Data Nodes (instance )"
      description: "Number Healthy Data Nodes less then number_of_data_nodes\n  VALUE = \n  LABELS: "

  - alert: ElasticsearchRelocationShards
    expr: elasticsearch_cluster_health_relocating_shards > 0
    for: 5m
    labels:
      severity: critical
    annotations:
      summary: "Elasticsearch relocation shards (instance )"
      description: "Number of relocation shards for 20 min\n  VALUE = \n  LABELS: "


  - alert: ElasticsearchInitializingShards
    expr: elasticsearch_cluster_health_initializing_shards > 0
    for: 5m
    labels:
      severity: warning
    annotations:
      summary: "Elasticsearch initializing shards (instance )"
      description: "Number of initializing shards for 10 min\n  VALUE = \n  LABELS: "


  - alert: ElasticsearchUnassignedShards
    expr: elasticsearch_cluster_health_unassigned_shards > 0
    for: 5m
    labels:
      severity: critical
    annotations:
      summary: "Elasticsearch unassigned shards (instance )"
      description: "Number of unassigned shards for 2 min\n  VALUE = \n  LABELS: "


  - alert: ElasticsearchPendingTasks
    expr: elasticsearch_cluster_health_number_of_pending_tasks > 0
    for: 5m
    labels:
      severity: warning
    annotations:
      summary: "Elasticsearch pending tasks (instance )"
      description: "Number of pending tasks for 10 min. Cluster works slowly.\n  VALUE = \n  LABELS: "


  - alert: ElasticsearchNoNewDocuments
    expr: rate(elasticsearch_indices_docs{es_data_node="true"}[10m]) < 1
    for: 5m
    labels:
      severity: warning
    annotations:
      summary: "Elasticsearch no new documents (instance )"
      description: "No new documents for 10 min!\n  VALUE = \n  LABELS: "
