On this page
ELK安装部署
1.日志收集规划
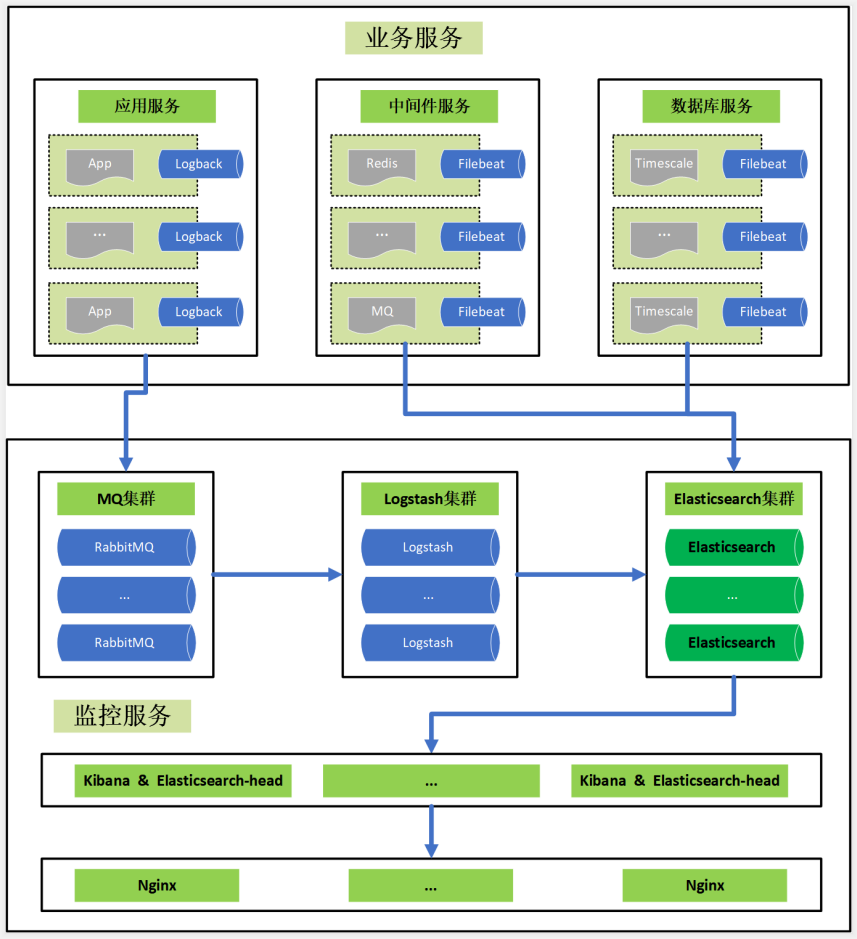
日志管理使用Elastic Stack框架,系统的重要日志进行聚合,统一管理。
涉及的组件包括:Elasticsearch、Filebeat、Logstash、Kibana、RabbitMQ、Nginx。
微服务日志通过Logback写到MQ(kafka或rabbitmq,目前选择rabbitmq),logstash读取MQ把日志写到Elasticsearch,通过Kibana查询。
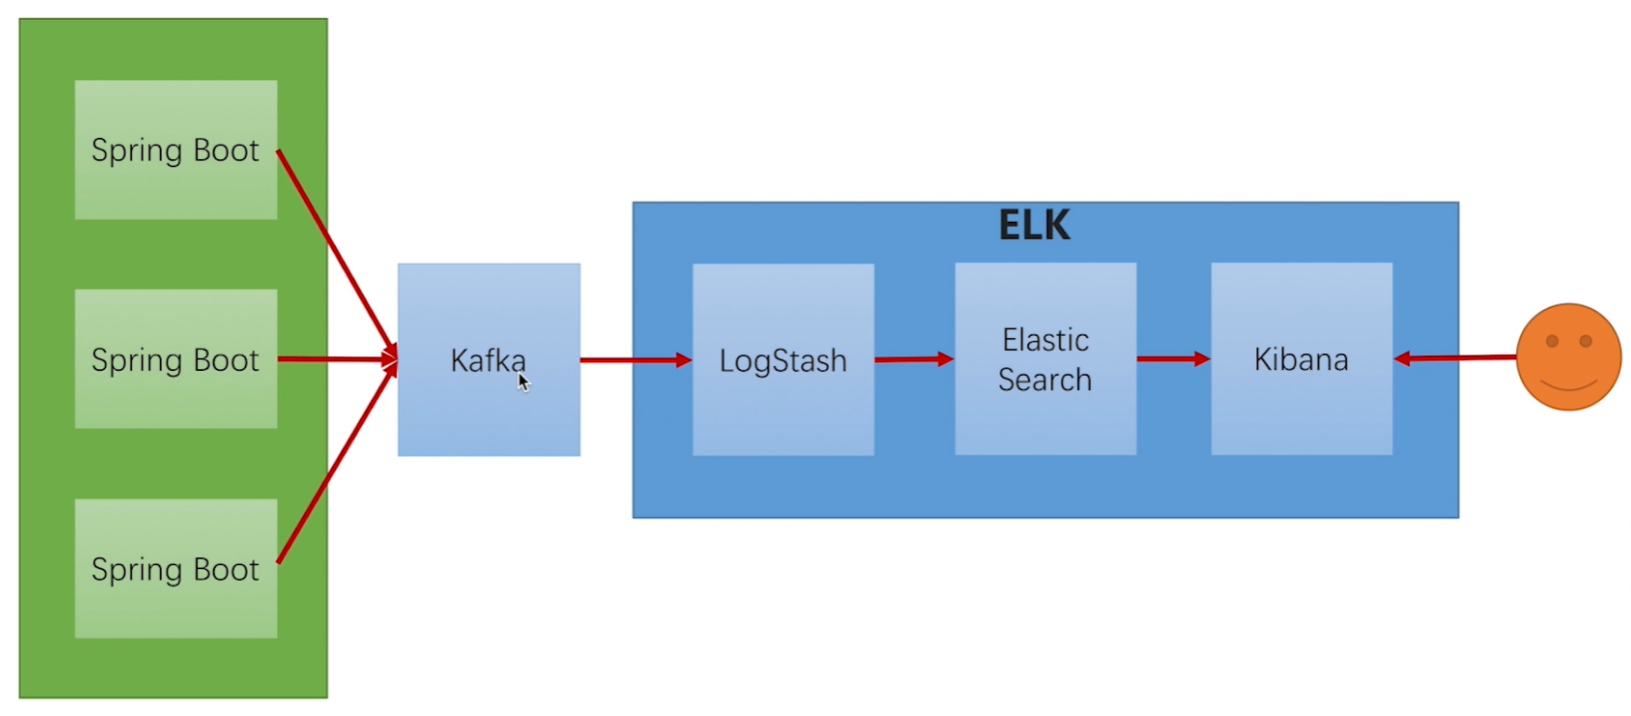
中间件、数据库日志通过Filebeat写到Elasticsearch,通过Kibana查询。
生产环境日志架构
2.Elasticsearch部署
2.1.Elasticsearch安装
1
2
3
4
5
6
7
8
9
10
11
12
13
14
15
16
17
18
19
20
21
22
23
24
25
26
| ### 准备工作
# 启动简单版,然后 copy 文件到 宿主机,最后删除该容器
# 创建目录
mkdir -p /elk/cluster/es
# 运行docker
docker run -tid \
--name=elasticsearch \
-p 19200:9200 \
-p 19300:9300 \
-v /etc/localtime:/etc/localtime \
-e ES_JAVA_OPTS="-Xms4g -Xmx4g" \
-e TZ='Asia/Shanghai' \
-e LANG="en_US.UTF-8" \
elasticsearch:7.1.1
# 复制配置文件
docker cp elasticsearch:/usr/share/elasticsearch/config/ /elk/cluster/es/
docker cp elasticsearch:/usr/share/elasticsearch/data/ /elk/cluster/es/
docker cp elasticsearch:/usr/share/elasticsearch/logs/ /elk/cluster/es/
docker cp elasticsearch:/usr/share/elasticsearch/plugins/ /elk/cluster/es/
# 删除镜像
docker stop elasticsearch
docker rm elasticsearch
|
1
2
3
4
5
6
7
8
9
10
11
12
13
14
15
16
17
18
19
20
21
| ### es-node-01配置(172.17.88.22)
# 修改配置文件
/elk/cluster/es/config/elasticsearch.yml
# elasticsearch.yml:
cluster.name: es-iids-cluster
node.name: es-node-01
node.master: true
node.data: true
network.host: 172.17.88.22
http.port: 9200
transport.tcp.port: 9300
discovery.seed_hosts: ["172.17.88.22", "172.17.88.19", "172.17.88.18"]
cluster.initial_master_nodes: ["es-node-01", "es-node-02", "es-node-03"]
bootstrap.memory_lock: false
http.cors.enabled: true
http.cors.allow-origin: "*"
# jvm.options
-Xms1g
-Xmx1g
|
其他三个节点配置相同。
1
2
3
4
5
6
7
8
9
| # 运行docker
docker run -d --name es-node-01 --net host --restart=always \
-v /elk/cluster/es/config/elasticsearch.yml:/usr/share/elasticsearch/config/elasticsearch.yml \
-v /elk/cluster/es/config/jvm.options:/usr/share/elasticsearch/config/jvm.options \
-v /elk/cluster/es/data/:/usr/share/elasticsearch/data/ \
-v /elk/cluster/es/logs/:/usr/share/elasticsearch/logs/ \
-v /elk/cluster/es/plugins/:/usr/share/elasticsearch/plugins/ \
elasticsearch:7.1.1
|
1
2
3
4
5
| ### 访问地址
# es-node-01(172.17.88.22)
http://47.95.238.119:19200/
curl '172.17.88.22:9200'
|
2.2.Elasticsearch-head安装
1
2
3
| # 运行Docker,三个节点分别安装
docker run -d --name es-head --restart=always -p 19100:9100 mobz/elasticsearch-head:5
|
1
2
3
4
5
6
7
8
9
10
11
| ### 安装遇到问题
# 连不上elasticsearch
docker exec -it elasticsearch /bin/bash
vi ES配置文件elasticsearch.yml加入2个参数,并重启
http.cors.enabled: true
http.cors.allow-origin: "*"
# 重启容器
docker restart elasticsearch
|
1
2
3
4
| # 访问地址
http://47.95.238.119:19100/
curl '172.17.88.22:19100'
|
2.3.Elasticsearch设置分片数
elasticsearch7.x 设置默认副本 和默认分片
1
2
3
4
5
6
7
8
9
10
11
| # 设置elasticsearch默认模板(之后创建索引副本为)
curl -X PUT 47.95.238.119:19200/_template/log -H 'Content-Type: application/json' -d '{
"template": "*",
"settings": {
"number_of_shards": 5,
"number_of_replicas": "1"
}
}'
"template": "*" 代表所有 索引
"template": "apple*" 代表生成apple*的索引都会按照这个模板来了
|
1
2
3
4
5
6
7
8
9
| # 设置默认分片5,副本1
curl -X PUT 47.95.238.119:19200/_template/log -H 'Content-Type: application/json' -d '{
"template": "*",
"settings": {
"number_of_shards": 5,
"number_of_replicas": 1
}
}'
|
2.4.elasticsearch健康检查
1
2
3
4
5
6
7
8
9
10
11
12
13
14
15
16
17
18
19
20
| # 常用查询命令
# 查看集群进程状态:
curl -u elastic:{password} -X GET "172.18.54.20:9200/_nodes/stats/process?pretty"
http://47.95.238.119:19200/_nodes/stats/process?pretty
#检查集群状态:
curl -u elastic:{password} -X GET "172.18.54.20:9200/_nodes/stats?pretty"
http://47.95.238.119:19200/_nodes/stats?pretty
# 查看ES集群健康状态
curl -u elastic:{password} -X GET "172.18.54.20:9200/_cluster/health?pretty"
http://47.95.238.119:19200/_cluster/health?pretty
curl -u elastic:{password} -X GET "172.18.54.20:9200/_cluster/health?level=indices"
http://47.95.238.119:19200/_cluster/health?level=indices
# 查看指定索引库的健康状态
curl -u elastic:{password} -X GET "172.18.54.20:9200/_cluster/health/{indexName}?pretty"
http://47.95.238.119:19200/_cluster/health/{indexName}?pretty
|
3.Kibana部署
1
2
3
4
5
6
7
8
9
10
11
12
13
14
15
16
17
18
19
20
21
22
23
24
25
| ### 准备工作
# 启动简单版,然后 copy 文件到 宿主机,最后删除该容器
# 创建目录
mkdir -p /elk/cluster/kibana
# 运行docker
docker run -tid \
--name=kibana \
-p 15601:5601 \
-v /etc/localtime:/etc/localtime \
-e TZ='Asia/Shanghai' \
-e LANG="en_US.UTF-8" \
kibana:7.1.1
# 复制配置文件
docker cp kibana:/usr/share/kibana/config/ /elk/cluster/kibana/
docker cp kibana:/usr/share/kibana/data/ /elk/cluster/kibana/
docker cp kibana:/usr/share/kibana/plugins/ /elk/cluster/kibana/
# 删除镜像
docker stop kibana
docker rm kibana
chmod 777 /elk/cluster/kibana/data
|
1
2
3
4
5
6
7
8
9
10
11
12
13
14
15
16
| # 修改配置文件
/elk/cluster/kibana/config/kibana.yml
# kibana.yml
server.port: 15601
server.name: kibana
server.host: "0.0.0.0"
elasticsearch.hosts: [ "http://172.17.88.22:9200", "http://172.17.88.19:9200", "http://172.17.88.18:9200" ]
xpack.monitoring.ui.container.elasticsearch.enabled: true
# 没有配置以下内容
elasticsearch.username: kibana
elasticsearch.password: keda123456
xpack.security.encryptionKey: "something_at_least_32_characters"
xpack.reporting.encryptionKey: "something_at_least_32_characters"
xpack.security.sessionTimeout: 600000
|
1
2
3
4
5
6
7
| # 运行docker
docker run -d --name kibana --net host --restart=always \
-v /elk/cluster/kibana/config/:/usr/share/kibana/config/ \
-v /elk/cluster/kibana/data/:/usr/share/kibana/data/ \
-v /elk/cluster/kibana/plugins/:/usr/share/kibana/plugins/ \
kibana:7.1.1
|
1
2
3
4
| ### 访问地址
http://47.95.238.119:15601
http://47.95.228.247:15601
http://123.56.18.37:15601
|
4.Logstash部署
1
2
3
4
5
6
7
8
9
10
11
12
13
14
15
16
17
18
19
20
21
22
23
24
25
26
27
| ### 准备工作
# 启动简单版,然后 copy 文件到 宿主机,最后删除该容器
# 创建目录
mkdir -p /elk/cluster/logstash
# 运行docker
docker run -tid \
--name=logstash \
-p 15044:5044 \
-p 19600:9600 \
-v /etc/localtime:/etc/localtime \
-e TZ='Asia/Shanghai' \
-e LANG="en_US.UTF-8" \
logstash:7.1.1
# 复制配置文件
docker cp logstash:/usr/share/logstash/config/ /elk/cluster/logstash/
docker cp logstash:/usr/share/logstash/pipeline/ /elk/cluster/logstash/
# 先不用
docker cp logstash:/usr/share/logstash/data/ /elk/cluster/logstash/
docker cp logstash:/usr/share/logstash/vendor/ /elk/cluster/logstash/
# 删除镜像
docker stop logstash
docker rm logstash
|
1
2
3
4
5
6
7
8
9
10
11
12
13
14
15
16
17
18
19
20
21
22
23
24
25
26
27
28
29
30
31
32
33
34
35
36
37
38
39
40
41
42
43
44
45
46
47
48
49
50
51
52
53
54
55
56
57
58
59
60
| # 修改配置文件
/elk/cluster/logstash/config/logstash.yml (可不配置)
http.host: "0.0.0.0"
xpack.monitoring.enabled: false
# /elk/cluster/logstash/pipeline/logstash.conf
# logstash.conf:
# 采集rabbitmq
input {
rabbitmq {
type =>"msa"
durable => true
exchange => "iids-elk-msa-exchange"
exchange_type => "direct"
key => "log"
host => "172.17.88.22"
port => 5672
user => "guest"
password => "guest"
queue => "iids-elk-msa-queue"
auto_delete => false
}
}
output {
elasticsearch {
hosts => ["172.17.88.22:9200", "172.17.88.19:9200", "172.17.88.18:9200"]
index => "%{appname}-%{+YYYY.MM.dd}"
}
stdout {
codec => rubydebug
}
}
# 采集filebeat
input {
beats {
port => 5044
}
}
output {
elasticsearch {
hosts => ["172.17.88.22:19200", "172.17.88.19:19200", "172.17.88.18:19200"]
index => "%{appname}-%{+YYYY.MM.dd}"
}
stdout {
codec => rubydebug
}
}
|
1
2
3
4
5
6
| # 运行docker
docker run -d --name logstash --net host --restart=always \
-v /elk/cluster/logstash/config:/usr/share/logstash/config \
-v /elk/cluster/logstash/pipeline:/usr/share/logstash/pipeline \
logstash:7.1.1
|
5.Filebeat部署
1
2
3
4
5
6
7
8
9
10
11
12
13
14
15
16
17
18
19
20
21
| ### rpm安装
rpm -vih filebeat-7.1.1-x86_64.rpm
# 启动filebeat服务
systemctl start filebeat
# 停止filebeat服务
systemctl stop filebeat
# 设置开机自启动
systemctl enable filebeat
# 常用命令
systemctl start filebeat #启动服务
systemctl stop filebeat #停止服务
systemctl enable filebeat #设置开机自启动
systemctl disable filebeat #停止开机自启动
systemctl status filebeat #查看服务当前状态
systemctl restart filebeat #重新启动服务
systemctl list-units --type=service #查看所有已启动的服务
|